Listen here on Spotify | Listen here on Apple Podcast
Episode released on May 1, 2025
Episode recorded on February 7, 2025
 Mario Bianco is a hydrologist/remote sensing specialist currently working in international consultancies with various groups, including the World Bank and United Nations. He has worked in 12 different countries on engineering management and Water, Sanitation, and Hygiene (WASH) issues helping provide clean water in urban and rural settings. This discussion was focused on Ukraine, Syria, and further international experiences.
Highlights | Transcript
Ukraine:
Mario worked in Ukraine in September 2023 to July 2024. Russia invaded Ukraine in February, 2014, occupying Crimea and part of the Donbass region. The full-scale invasion of Ukraine began in February 24, 2022.
Background on Ukraine:
- Largest country in Europe, area: 600 000 km2, slightly smaller than the size of Texas
- Population peaked in 1993 (52 million) and Ukraine had the lowest birth rate in Europe with the population declining to 46 million in 2014 and 38 million in 2023 (Fig. 1)
- The Russian invasion (2022) resulted in ~ 6.9 million refugees recorded globally in March 2025 (link).
- The distribution of refugees is as follows: ~1.2 M Russia, ~1.2 M Germany , ~1 M Poland, ~400,000 in Czech Republic and less in other EU countries (link, Fig. 2).
- Internally displaced persons: 0.85 M, 2021; increased to 5.9 M, 2022, 3.7 M, 2023; 4.6 M as of January, 2025 (Source: Ukrainian IDPs Poorer Than Those Who Went Abroad).
- Approximately 12.7 million people are in need of humanitarian assistance in 2025, including nearly 2 million children (Ukraine Refugee Crisis: Aid, Statistics and News | USA for UNHCR).
- Pacific Institute Water Conflict Chronology (link)
- 1941: destruction of the Dnipro Dam during WW II by the Russians. Construction of the dam had been completed in the 1930s.
- War in 2014 with invasion of Crimea and easter part of Donbas in Ukraine.
- Destruction of Kakhovka Dam on Jun 6 2023; Kakhova reservoir ~20 km3 (~16 maf) before destruction loss of water corresponding to ~ half of the capacity of Lake Mead, largest US reservoir
- Groundwater levels fell by about 40 m in the surrounding region (link).
- Kakhovka dam had a hydropower capacity of ~350 MW, lost because of destruction, supplied energy for water treatment, resulted in loss of 65% electricity generation, energy and water linked through water distribution, wastewater treatment, and water treatment.
- Destruction of the dam resulted in land mines being transported over large areas, challenging mine clearance operations..
- Electricity generation: Zaporhizia Nuclear Power Plant seized by Russia, 6000 MW capacity, shut down in March 2023.
- Mario worked in the WASH sector on water supplies with local water utilities, termed Vodokanals, in urban and rural settings in eastern and southern Ukraine (Kharkiv, Odessa, Mikolayv, Dnipro). Work mostly involved networking with water utilities, follow up on construction and rehabilitation projects as well as proposal development. This required strong engagement with government counterparts and coordination with other humanitarian agencies.
- Groundwater identified as a backup supply; however, there was very limited data on groundwater. Because potential drilling areas were close to the front lines, they could not deploy geophysics or fly drones or helicopters. Literature, documentation, and previous studies were also limited. Boreholes and water facilities happened to be within or proximal to minefields (fig. 3).
- Ukraine: low population growth, amplified by effects of water on human resources. It was difficult to find contractors willing to deploy rigs and equipment in areas at risk, particularly in open fields subject to air strikes.
- Loss of knowledge, documentation (destroyed by Russian forces in occupied territories before withdrawing in 2022 and 2023), and human resources affects water utilities.
- Logistics were very complicated: non-profits have to justify costs, limited range of cost variability allowed, difficult to develop cost estimates because of so much uncertainty, e.g., groundwater table depth, drilling costs etc. Also they had to deal with regulations and legislation.
- Engineers working on projects may need to travel between different regions of Ukraine, often crossing multiple administrative boundaries (namely oblasts) and military checkpoints, with the added risk of conscription. Water infrastructure already compromised before the war, World Bank document indicated leakages of 30 – 50%. Inefficiency results in much higher volumes of water requiring treatment and chemicals required for treatment (chlorine etc).
- The heating system also worked using water and was impacted.
- Multisector Needs Assessment dashboard Link (June to Aug 2023), WASH cluster, data provided by WASH sector in Ukraine.
- Water sources: 41% piped, 48% boreholes and wells, 13% bottled water
- Water treatment options listed antiquated, mostly boiling 15%
- Water scarcity not listed as a problem
- Crop production greatly impacted by invasion. Recent study indicates that only 2% of crop production was irrigated. Source: Rosa et al., 2024, Nature Food). Products: oils, maize, and wheat.
- Food trade Ukraine to all countries globally.
- Wheat, maize, oil seeds
- International food trade of all commodities declined from $55 billion in 2021 to 38 billion in 2022 after the war.
- Food exports accounted for $26 Billion in 2022.
- Rehabilitation, restoring services to provide minimum water quantity
- International aid provides technical assistance
Need to work with non-technical staff in coordination, leadership, and liaison roles, while also considering social and cultural aspects.
Syria:
- Mario worked in Syria in 2018 and in 2021.
- Arab Spring in 2011.
- Conflict started in Daraa Governorate in Southern Syria.
- The Assad regime and its core supporters largely came from the coastal areas of Syria. The coastal region received a lot of Internally Displaced Persons (IDPs) from other regions.
- Main purpose of project: resizing and maintaining water infrastructure, and developing homes for IDPs and medical facilities.
- Background: Syrian population increasing from ~ 10 million in 1980 to 23 million in 2011 (Fig. 4).
- Arab Spring in 2011, full blown conflict by 2014.
- Refugees from Syria: over 3 M in Turkey, 0.75 M in Lebanon, 0.75 M in Jordan, and similar number in Germany as of 2024 (Fig. 5).
- 6 M internally displaced persons (IDPs).
- Large reduction in electricity production in 2011 (Fig. 6), affecting water treatment.
- Chlorination was difficult because chlorine gas could be used as a chemical weapon. A special waiver applied for some humanitarian agencies to be able to import chlorine.
- Pumping stations degraded in Syria (Fig. 7).
- Several villages and towns along the coastline receive water for a few hours every couple of weeks, mainly because pumps for pushing water through the water network were only partially functioning in 2018.
- 2021: Marios worked in Damascus, rural Damascus, and southern Syria: situation was worse, power cuts countrywide including in the capital city Damascus.
- Agriculture decreased in Syria as a result of the conflict, reduced irrigation, groundwater levels rose, springs started flowing, for example in the Orontes Basin (Mhanna et al., 2023)
- Groundwater contamination near city of Damascus because sewage treatment operations were disrupted and sewage was used for irrigation.
- Replacement of transformers for submersible pumps represented a large part of work because the cables inside transformers were stolen, because they were typically made of copper.
Work in East Africa in 2011 and 2012, including in refugee camps and settlements for internally displaced persons (IDPs).
- Participated in a field assessment to plan the emergency response to the ongoing drought in Wajir County, Kenya, near the Somali border, during the summer of 2011.
- Worked on water supply systems in Dadaab refugee camp, Kenya, in 2012, in response to the 2011 drought (Fig. 8), which caused an estimated 50,000 to 100,000 deaths, over half of them children under five, across Somalia, Ethiopia, and Kenya, and led to the displacement of around 350,000 refugees into Dadaab (Source: East Africa's drought: the avoidable disaster | Africa | The Guardian and Horn of Africa sees 'worst drought in 60 years' - BBC News).
- Working in Somalia and Somaliland on various WaSH and natural resources management projects.
- Worked in Wajir County in Kenya bordering Somalia.
- Livestock in area surrounding Wajir dead from drought in 2011 (Fig. 9) (Source: (20) The 2011 Famine in Wajir County (Kenya): Vulnerability and the Humanitarian Response | LinkedIn)
- The only animals who survived were giraffes because they could access canopy leaves (Fig. 10)
- Cows fed moistened paper during 2011 drought (Fig. 11)
- Massive displacement from Somali into Kenya.
- Most boreholes and pumps not working (they were either broken or lacked fuel for powering the pumps) (Fig. 12)
- Functioning boreholes with windmills were used to provide water to irrigate some regions in Wajir County (Kenya, bordering Somalia) during 2011 drought (Fig. 13)
- Water was trucked to refugee camps and communities used plastic to collect the trucked water (Fig. 14)
- Security big issue in Dadaab refugee camp: colleagues kidnapped.
- Changed program to work with host community in Dadaab town
- Moved in a convoy, first car Kenyan army, used to detect unexploded ordinances on the way to Dadaab Refugee Camp.
Famine Early Warning System, forecast drought with up to 6 months lead times to avoid famine that was experienced in 2011 – 2012.
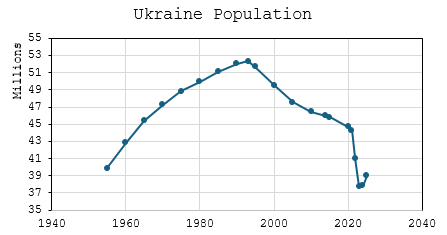
Figure 1. Evolution of Ukrainian population showing increase up to 1990s followed by gradual decline and marked decline after invasion in 2022 (link). 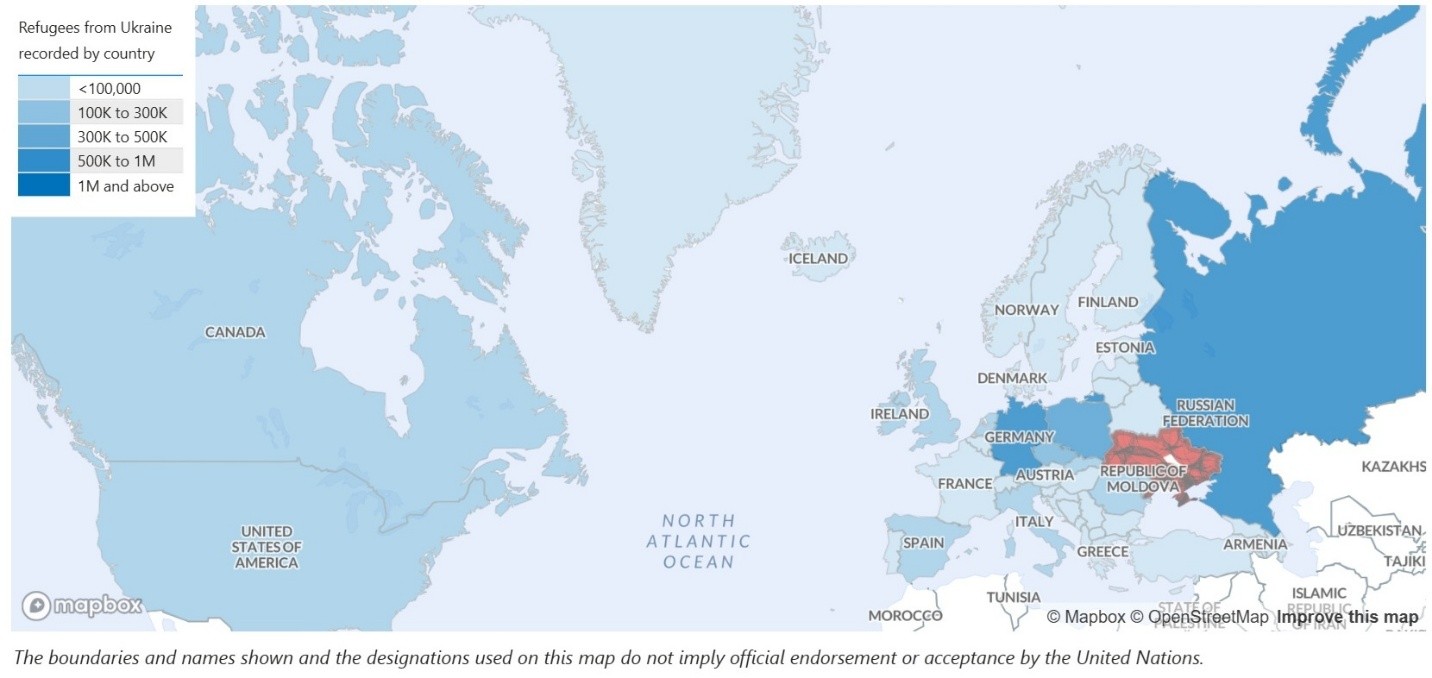
Figure 2. Distribution of Ukrainian refugees by country (link). 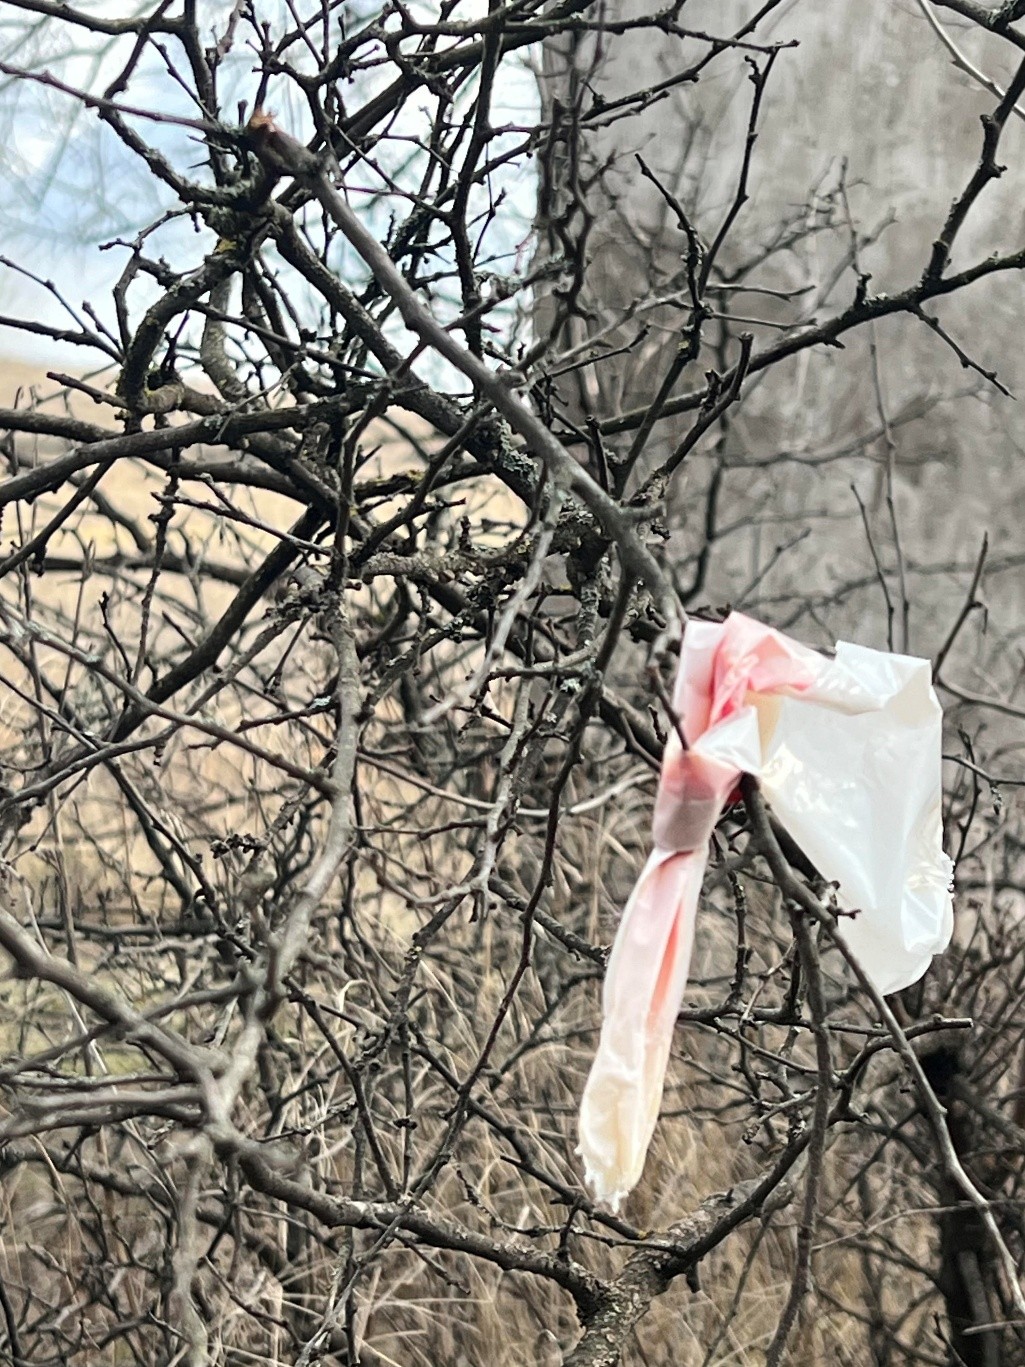
Figure 3. Borehole and water reservoir surrounded by a minefield in Ukraine. The red and white tape attached to trees' branches typically marks a minefield. Photo by Mario Bianco, spring 2024. 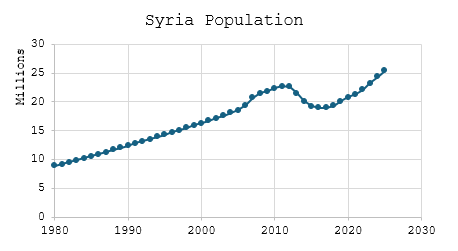
Figure 4. Time series of Syrian population showing rapid increase from 1980 to early 2010s, followed by decline up to late 2010s and rapid increase to present (link). 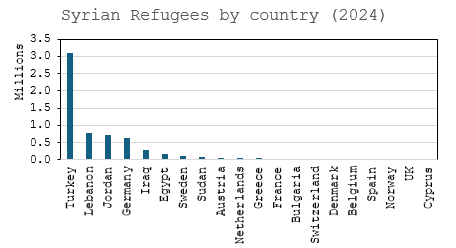
Figure 5. Distribution of Syrian refugees by country in 2024 (Statistica). 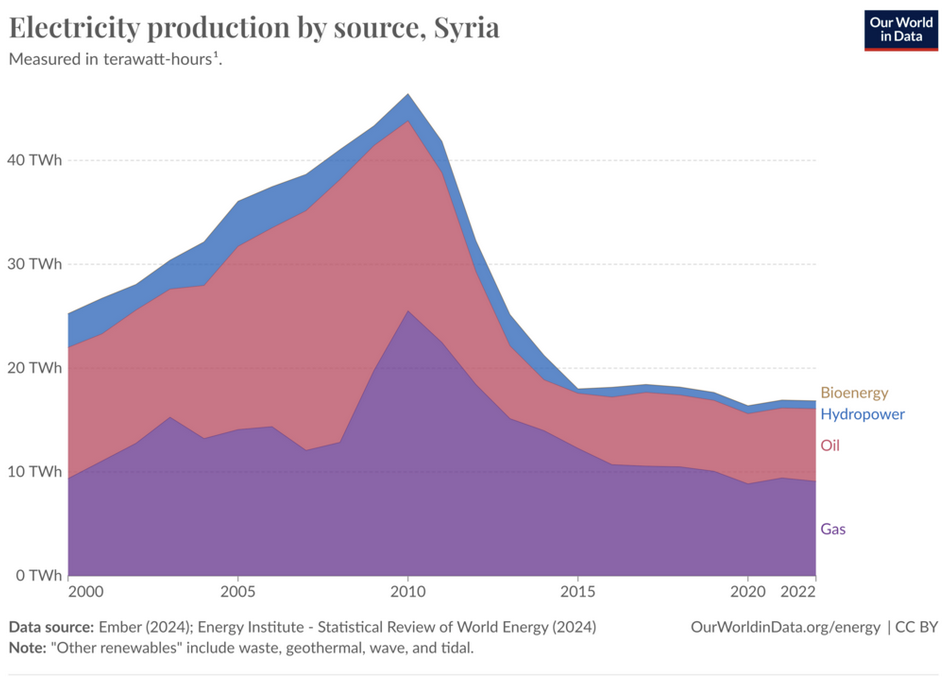
Figure 6. Electricity production in Syria by source showing increase until early 2010s followed by marked decline in electricity from natural gas and oil (Source: OurWorldinData). 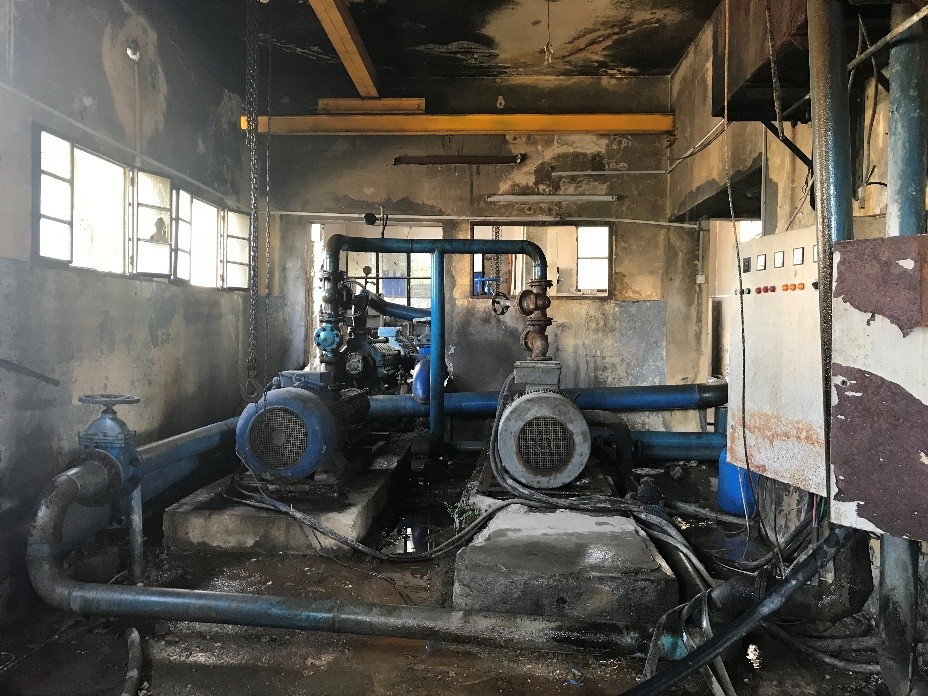
Figure 7. Degraded status of pumping station in Syria. Photo by Mario Bianco, 2018. 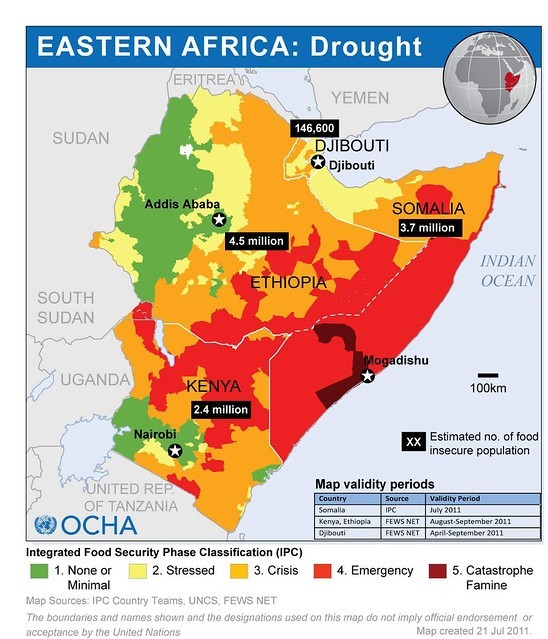
Figure 8. Integrated Food Security Phase Classification in East Africa (OCHA, July 2011). 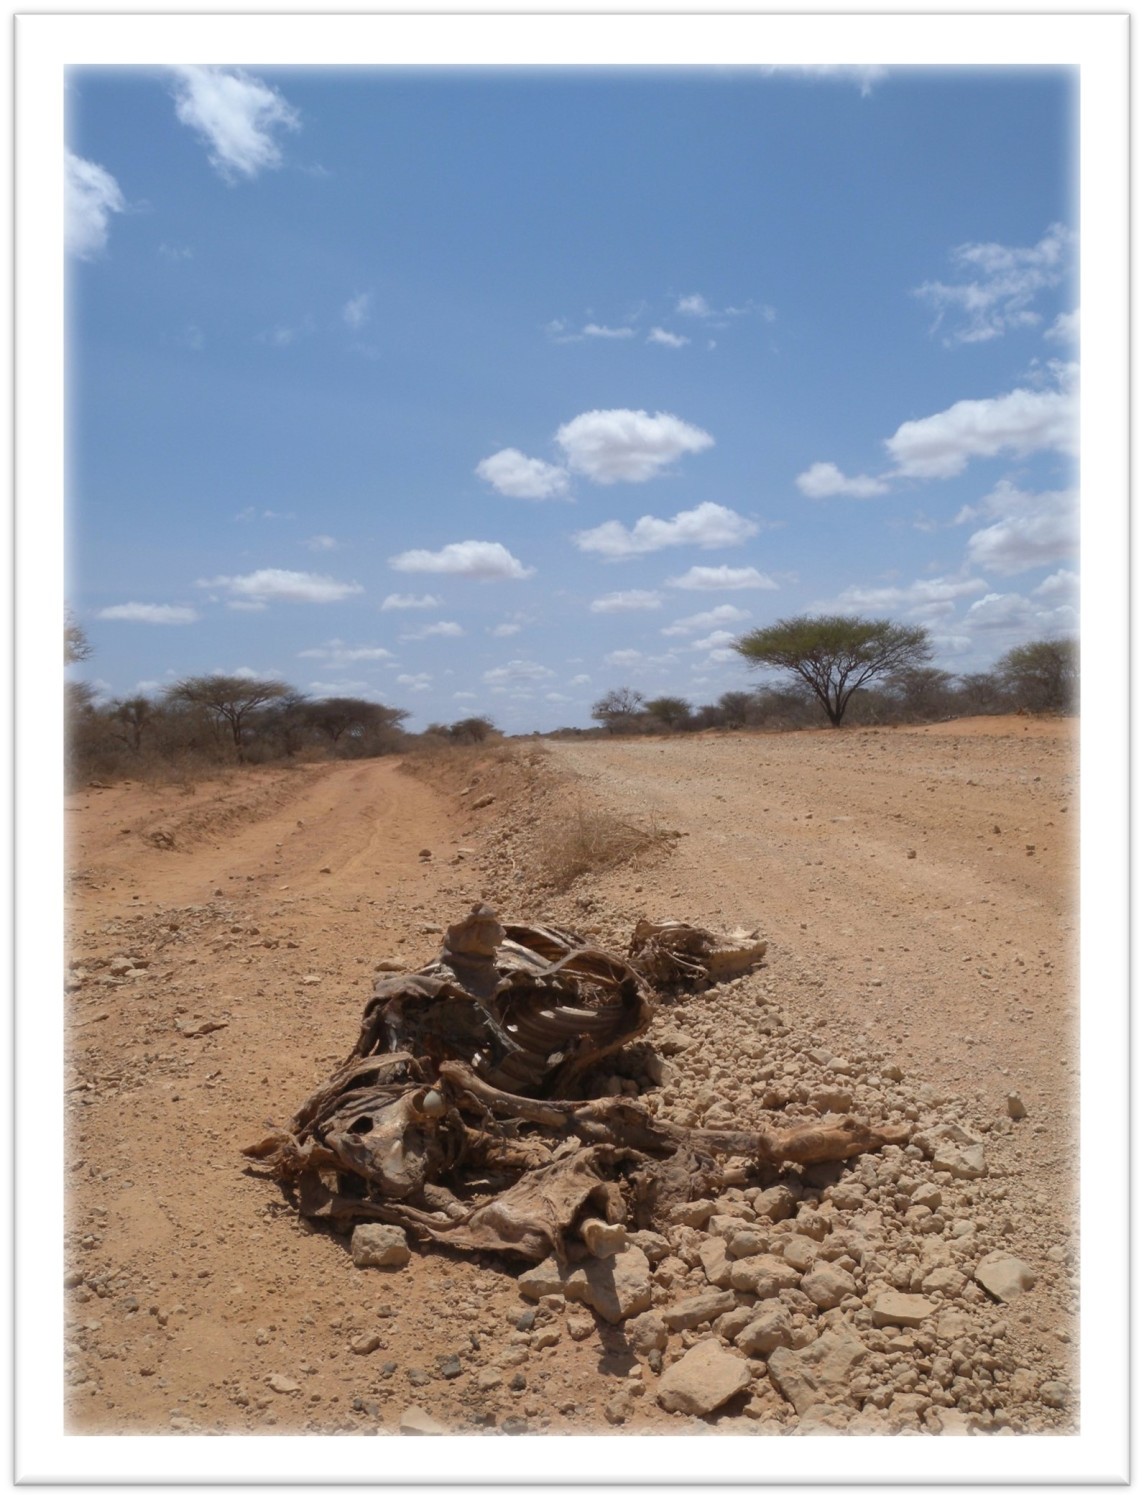
Figure 9. Animal carcass on the road to Wajir. Photo by Mario Bianco, August 2011. 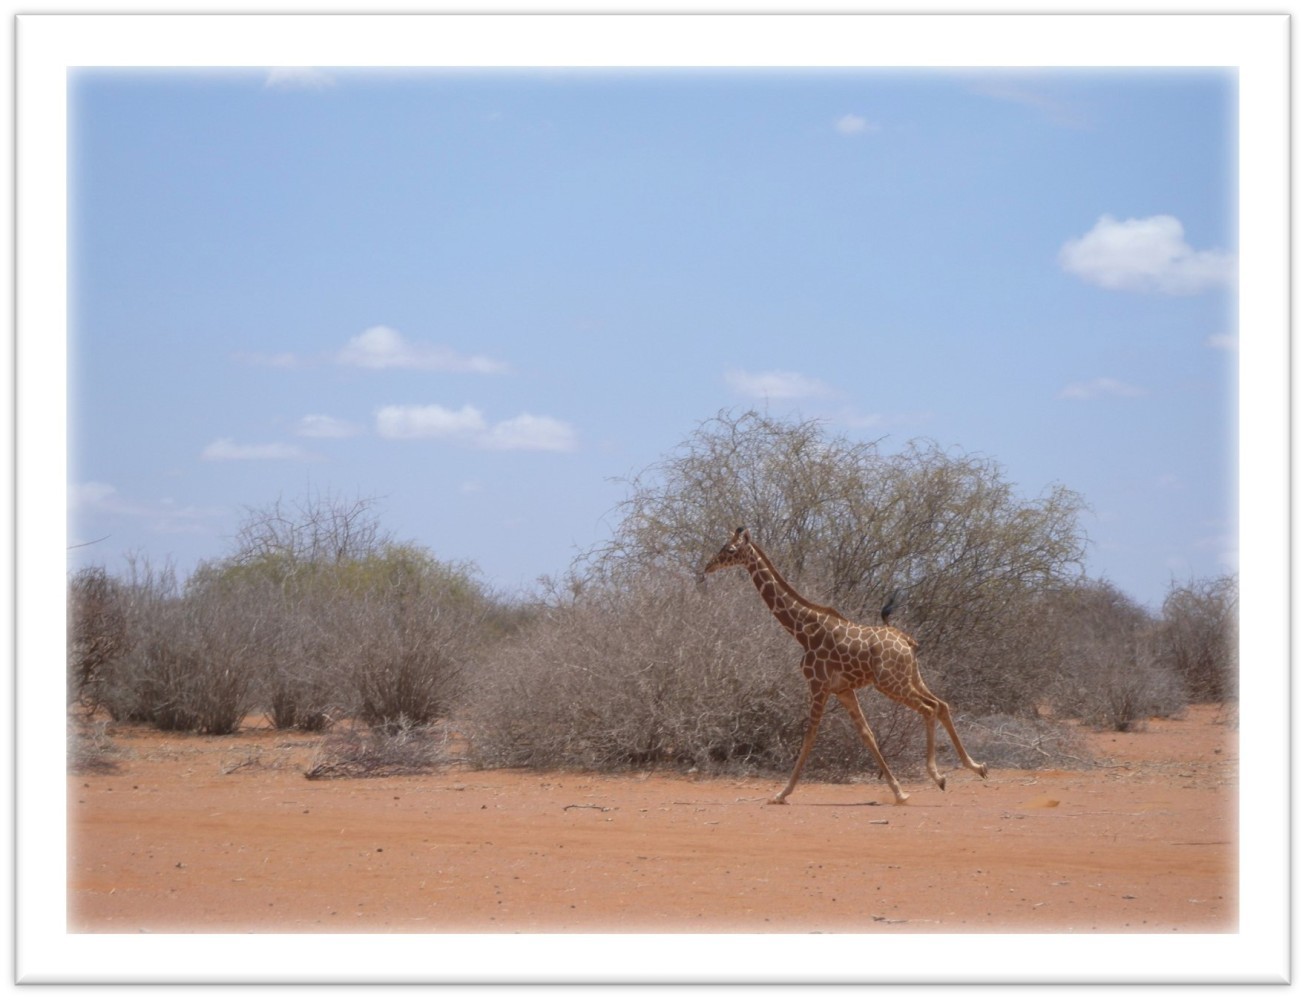
Figure 10. In the summer of 2011, giraffes were among the few animals spotted around Wajir, likely due to their ability to feed on tree canopies. Photo by Mario Bianco, August 2011. 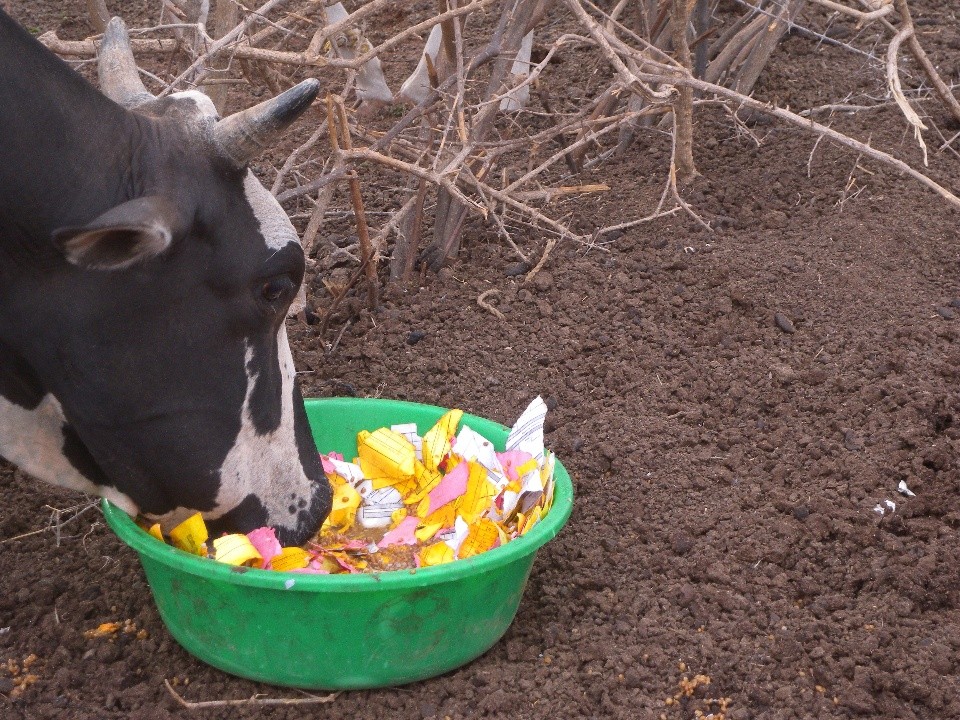
Figure 11. Cow being fed with paper in Wajir during the 2011 drought. Photo by Mario Bianco, August 2011. 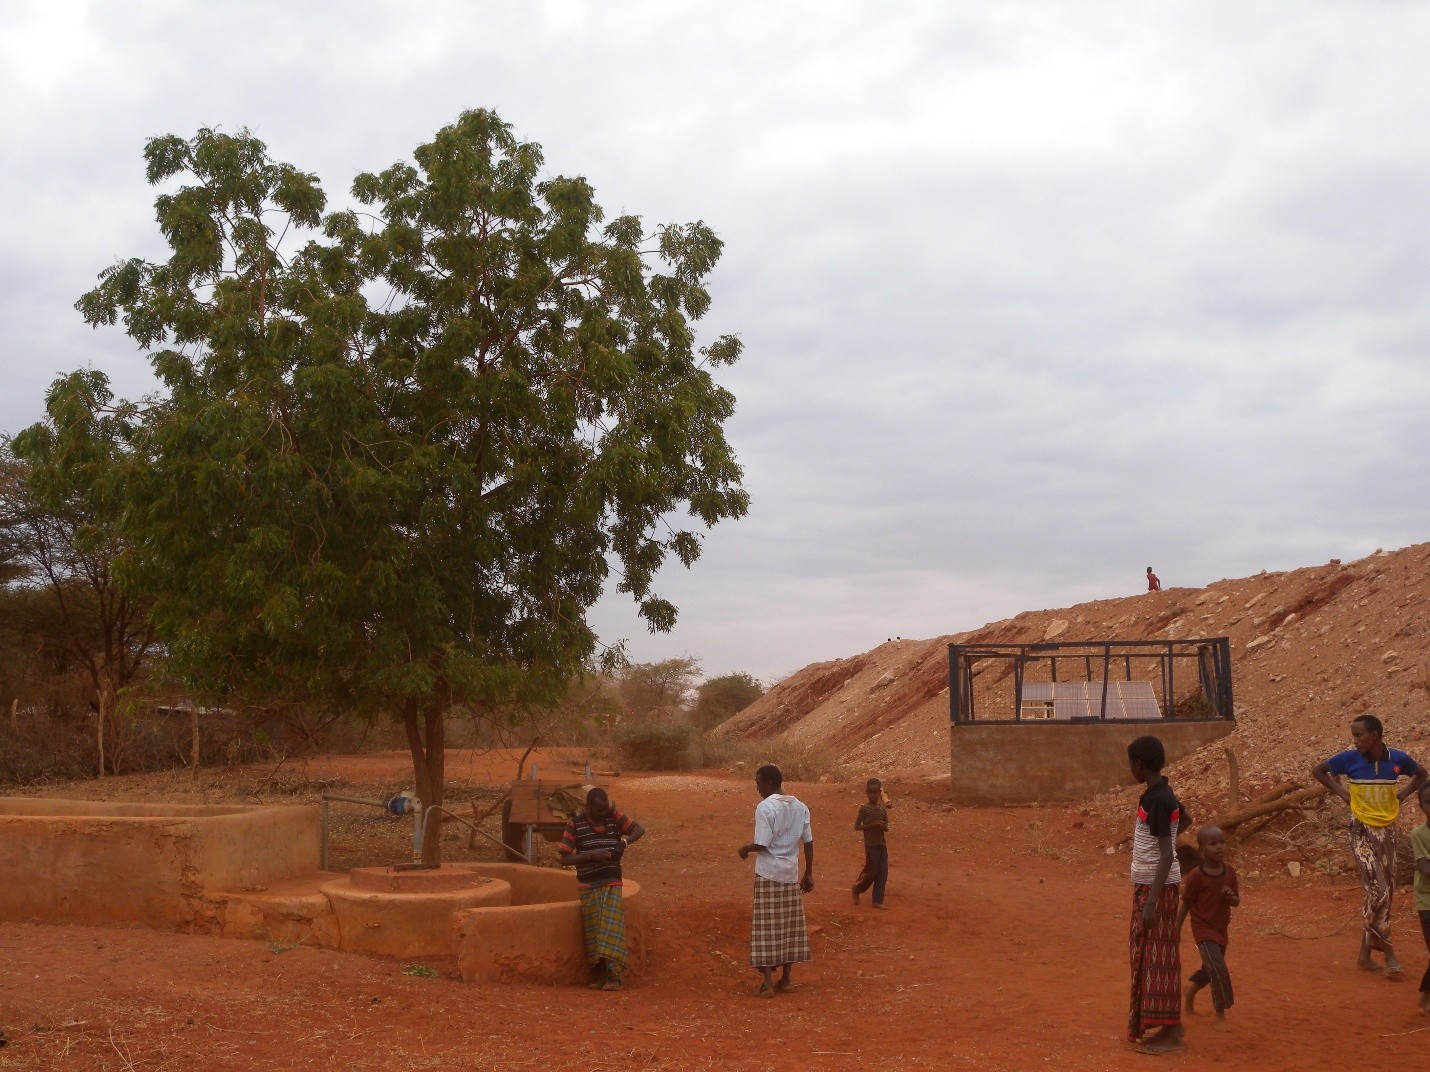
Figure 12. Non-operational submersible pump during 2011 drought in Wajir County, Kenya. The well was powered by a genset and also solar panels as shown on right. Photo by Mario Bianco, August 2011. 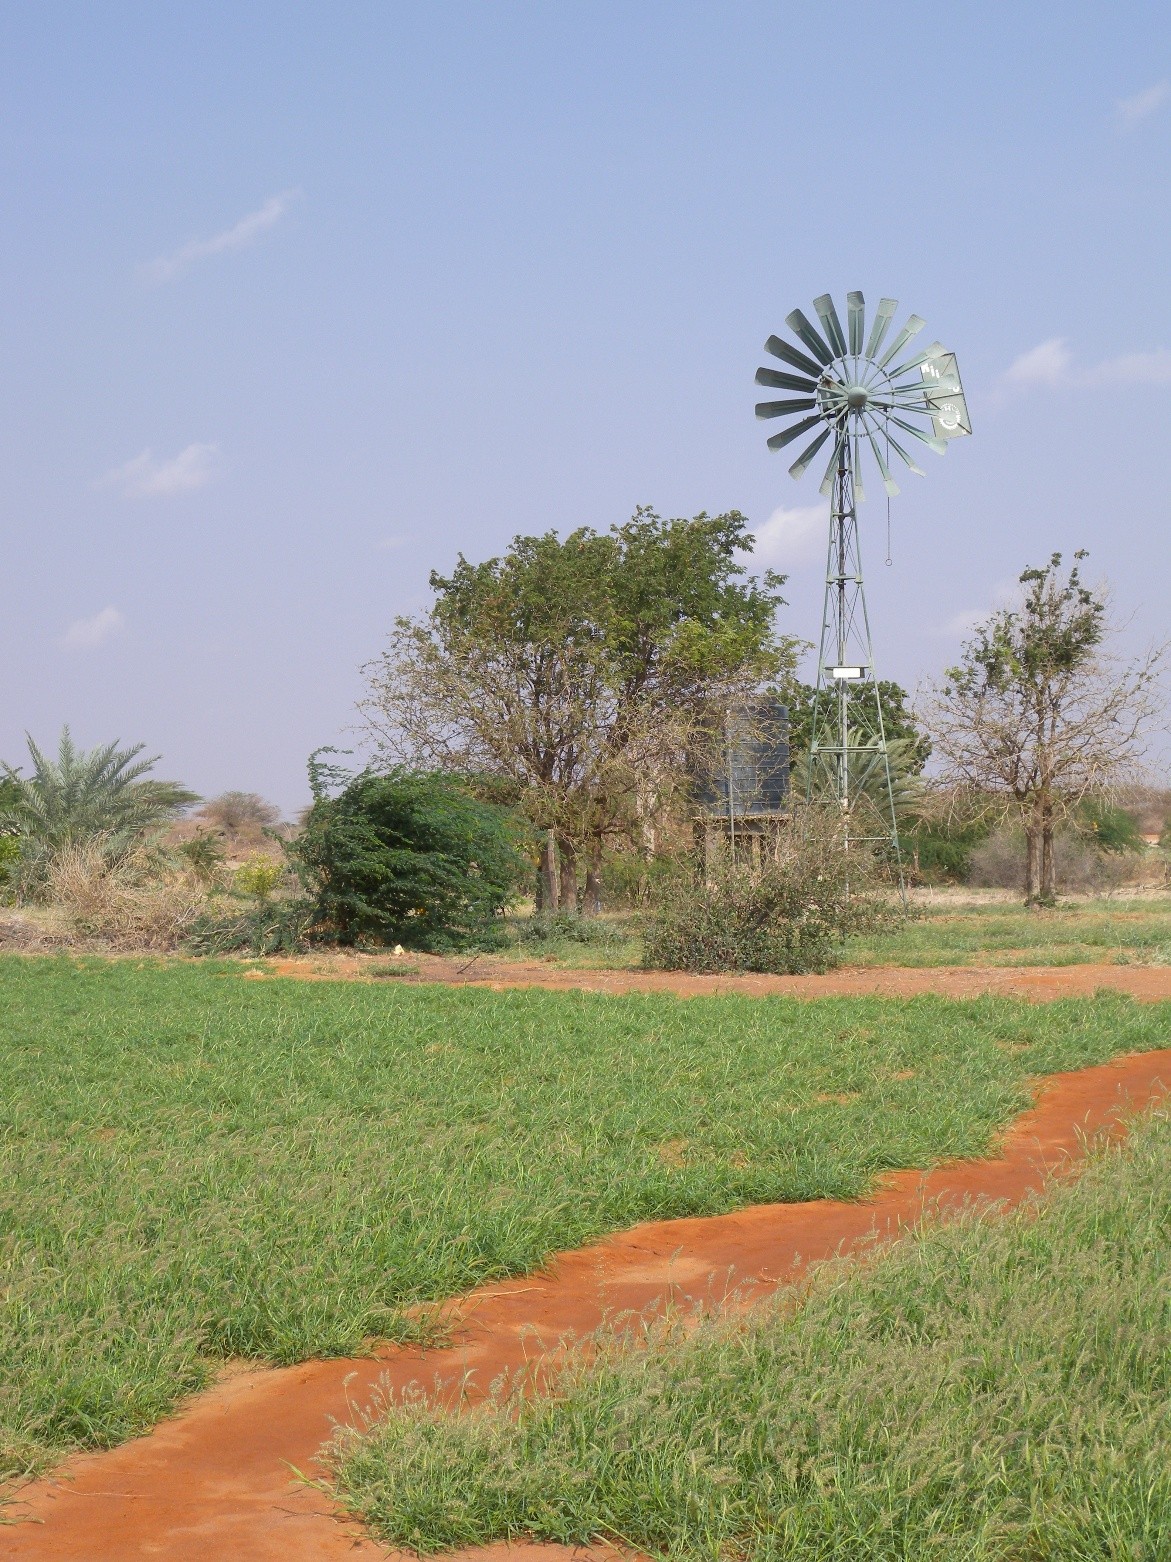
Figure 13. Functioning pump during the 2011 drought surrounded by irrigated fields in Wajir County, Kenya. Photo by Mario Bianco, August 2011. 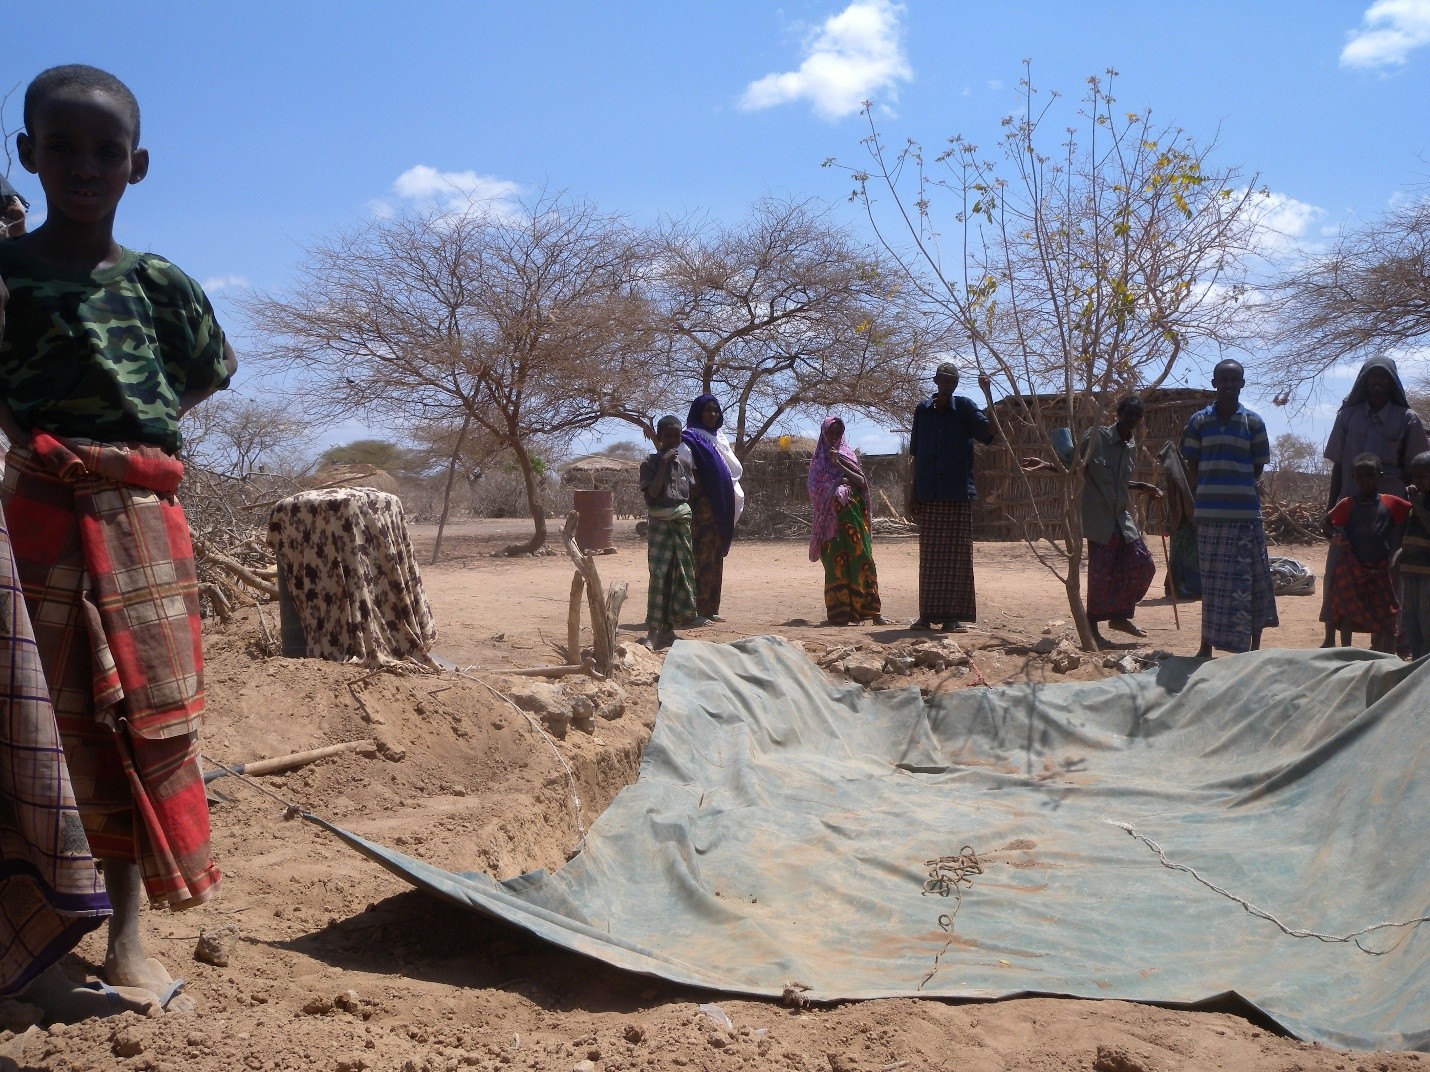
Figure 14. Local community preparing to collect water shipped through water trucking in Wajir (July, 2011). Photo by Mario Bianco, August 2011.

