Listen here on Spotify | Listen here on Apple Podcast
Episode released on September 5, 2024
Episode recorded on May 10, 2024
 Claudia Faunt is the Program Chief for the Groundwater Availability and Use Section at the US Geological Survey California Water Science Center in San Diego.
Highlights | Transcript
Claudia published a new paper titled Groundwater Sustainability and Land Subsidence in California's Central Valley in the journal Water (April 2024).
Focus on Central Valley groundwater (GW) availability in relation to the 2014 Sustainable Groundwater Management Act (SGMA), highlighting subsidence.
Updated from 2009 Central Valley Hydrologic Model (Faunt, USGS, 2009).
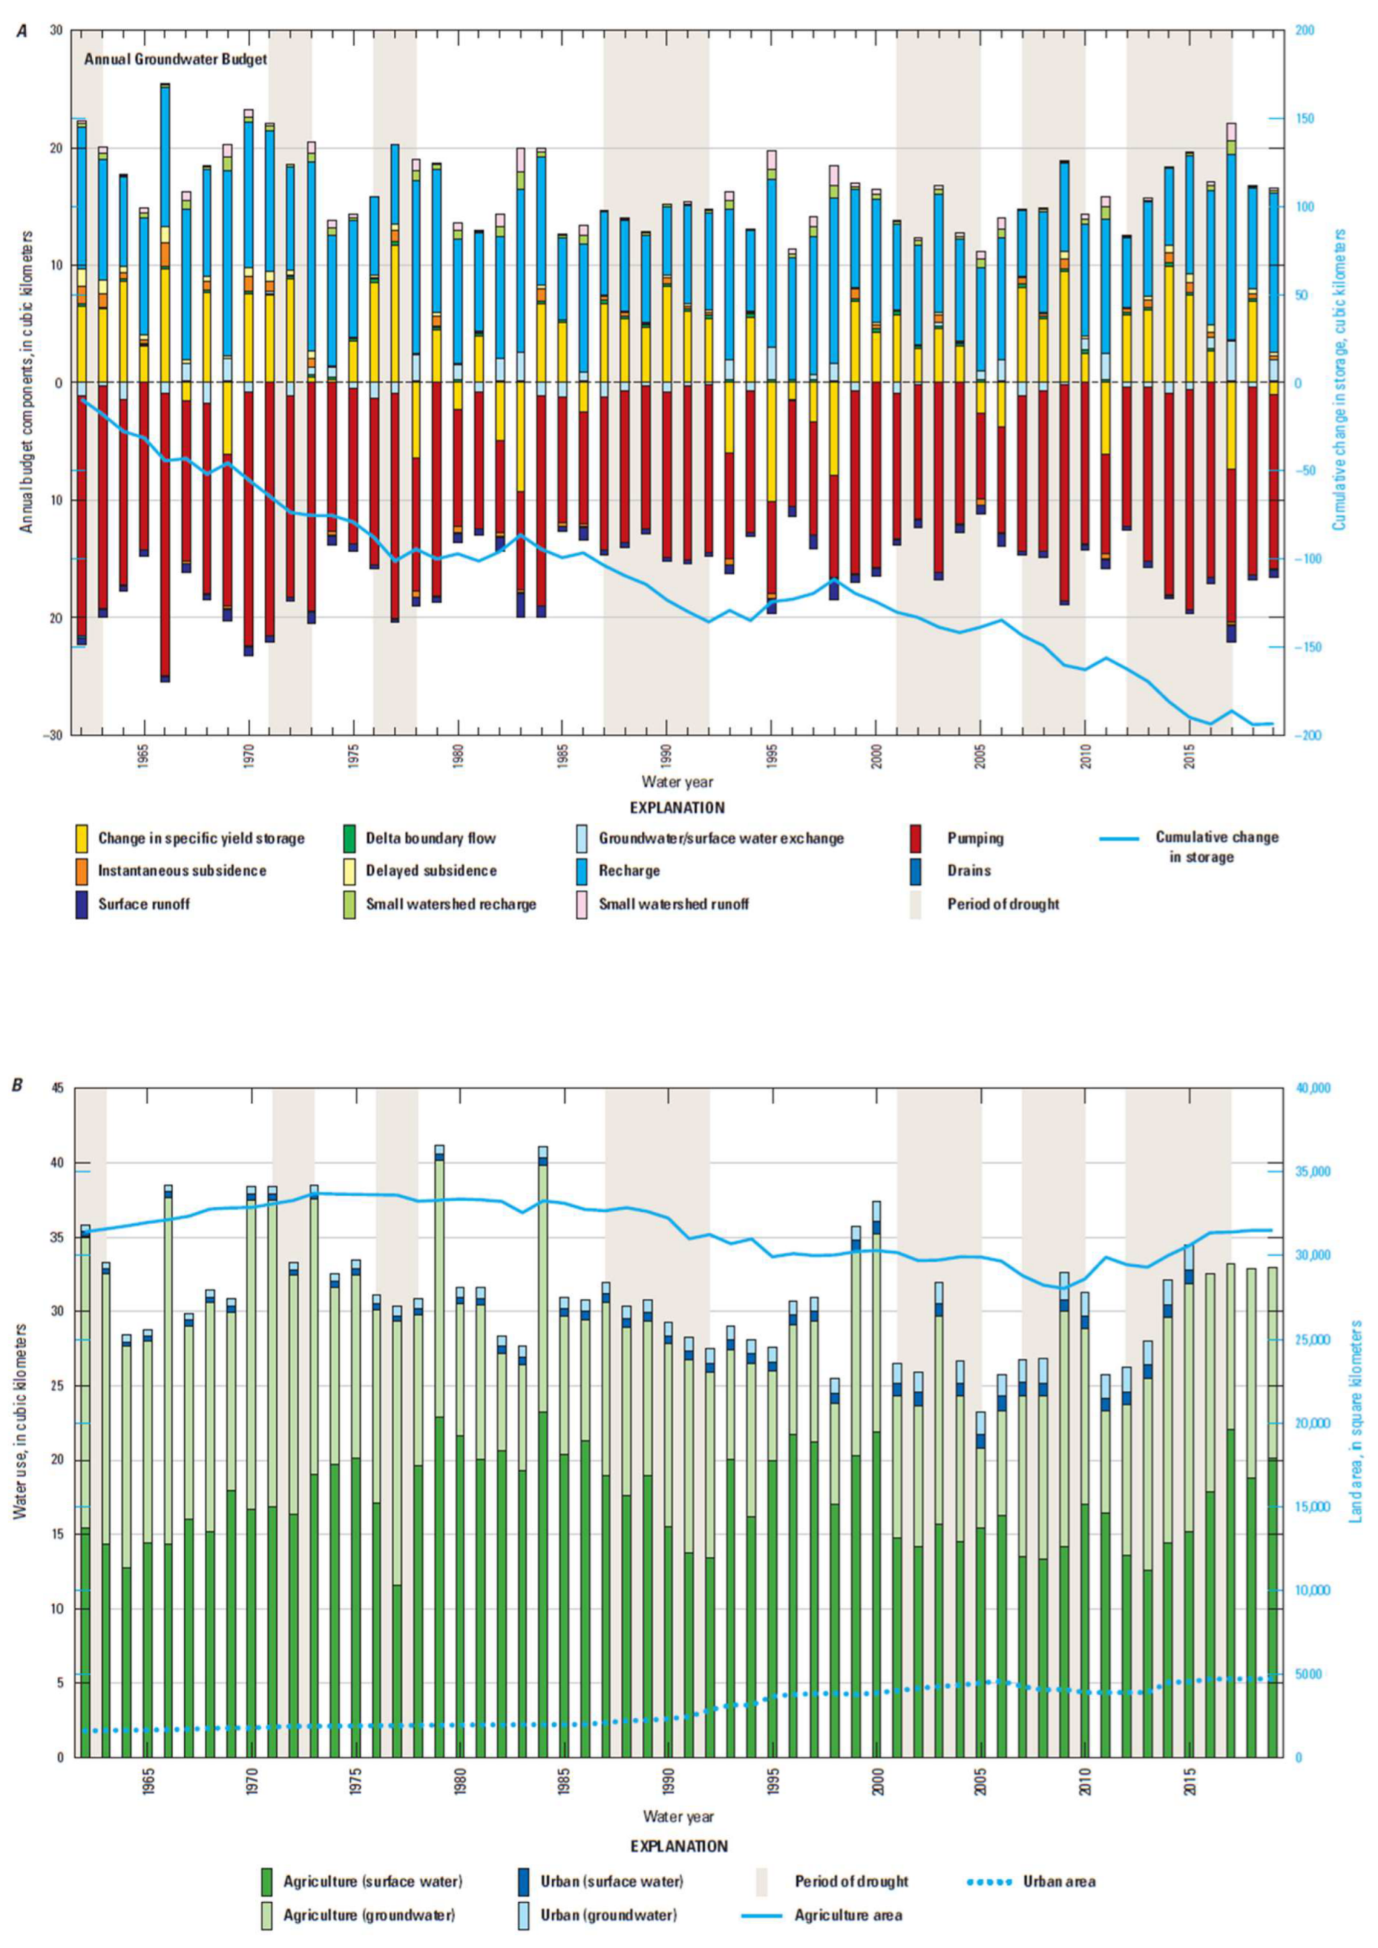
Continued losses in storage, especially in the Tulare Basin during 2007 – 2009 and 2012 – 2016 droughts (Fig. 1).
Sustainable Groundwater Management Act:
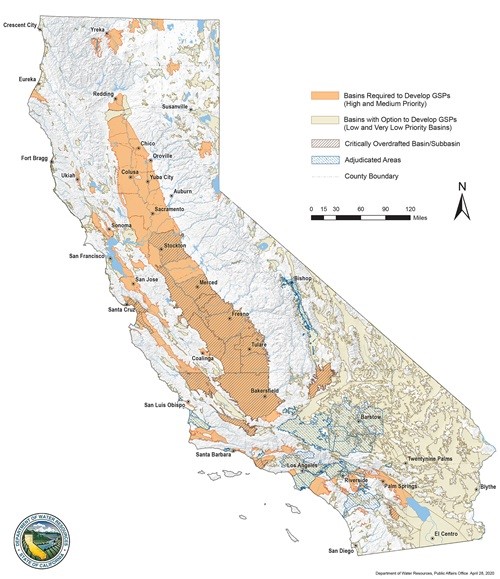
Goal: achieve long-term sustainability in California´s groundwater basins medium and high priority basins to form Groundwater Sustainability Agencies and plans (Fig. 2).
Local control and management and State provides a backstop if GSAs cannot manage the system (bottom up approach).
GRACE and InSAR (Interferometric Synthetic Aperture Radar) satellite data provided data and images to help the public understand the storage losses and subsidence.
SGMA: minimum thresholds .
Sustainability Components Six Undesirable Results to be avoided:
- Chronic lowering of GW levels
- Significant and unreasonable reduction of GW storage
- Significant and unreasonable seawater intrusion
- Significant and unreasonable degradation of water quality
- Significant and unreasonable land subsidence
- GW related surface water depletions with significant and unreasonable adverse impacts on beneficial uses of surface water
2014 60 Minutes news episode on Water with Leslie Stahl had equal emphasis on GRACE satellite data and ground-based monitoring (aired Nov. 14, 2016)
Code used for recent modeling: MODFLOW One Water Hydrologic flow Model, integrating SW and GW and linking land use, irrigation, water demands, and subsidence.
GW and SW are used conjunctively to meet demands.
Central Valley:
Large structural trough (graben, 5 km deep in S and 10 km deep in N) filled with sands and gravels (~ 30%), silts and clays (~70%) shed from surrounding mountains. Sediments fine in SW (Corcoran Clay) and coarser in E and S (alluvial fans from Sierra Nevada mountains).
Reservoirs: snow, surface reservoirs (hydroelectricity, flood control) à irrigated agriculture.
Fine-grained sediments result in aquifer being semi-confined and pressurized.
Originally tule marsh in south, first wells were artesian, flowing at surface, GW gradually depleted and subsidence occurred with drainage of marshes and expansion of irrigation. GW levels declined by 100s of feet in some regions.
Federal Government: Central Valley Project, aqueduct transporting water from humid north to semiarid south.
State Water Project: Transports water from North to South also.
National Geographic: California’s Pipe Dream
Water transfers allowed GW levels to recover and stopped subsidence for decades.
Causes of renewed GW depletion and subsidence:
Subsidence re-occurred during 2007 – 2009 drought.
Irrigation expansion to areas without access to SW
Water demand hardening with crop changes for annual and truck crops that can be fallowed to perennial nut trees (e.g., almonds, pistachios) and vineyards.
Reduced SW deliveries during drought because of ecosystem issues (e.g., Delta smelt)
Climate extremes: long term droughts interspersed with intense floods (often linked to atmospheric rivers) (Fig. 1)
Tulare lake flooding from atmospheric rivers.
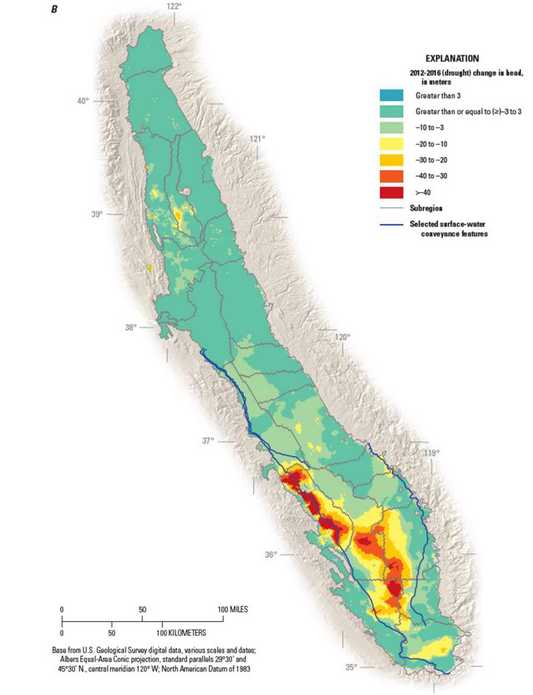
Simulated GW levels declined ≥40 m in some parts of SW Central Valley (Fig. 3).
GW wells going dry: ~ 4,000 wells, 2012 – 2022; 3,000 wells in San Joaquin Valley (Bostic et al., 2023, Nature Sci. Repts.)
Central Valley switches from ~ 70% SW use during wet periods to 70% GW use during droughts, amplifying impacts of droughts.
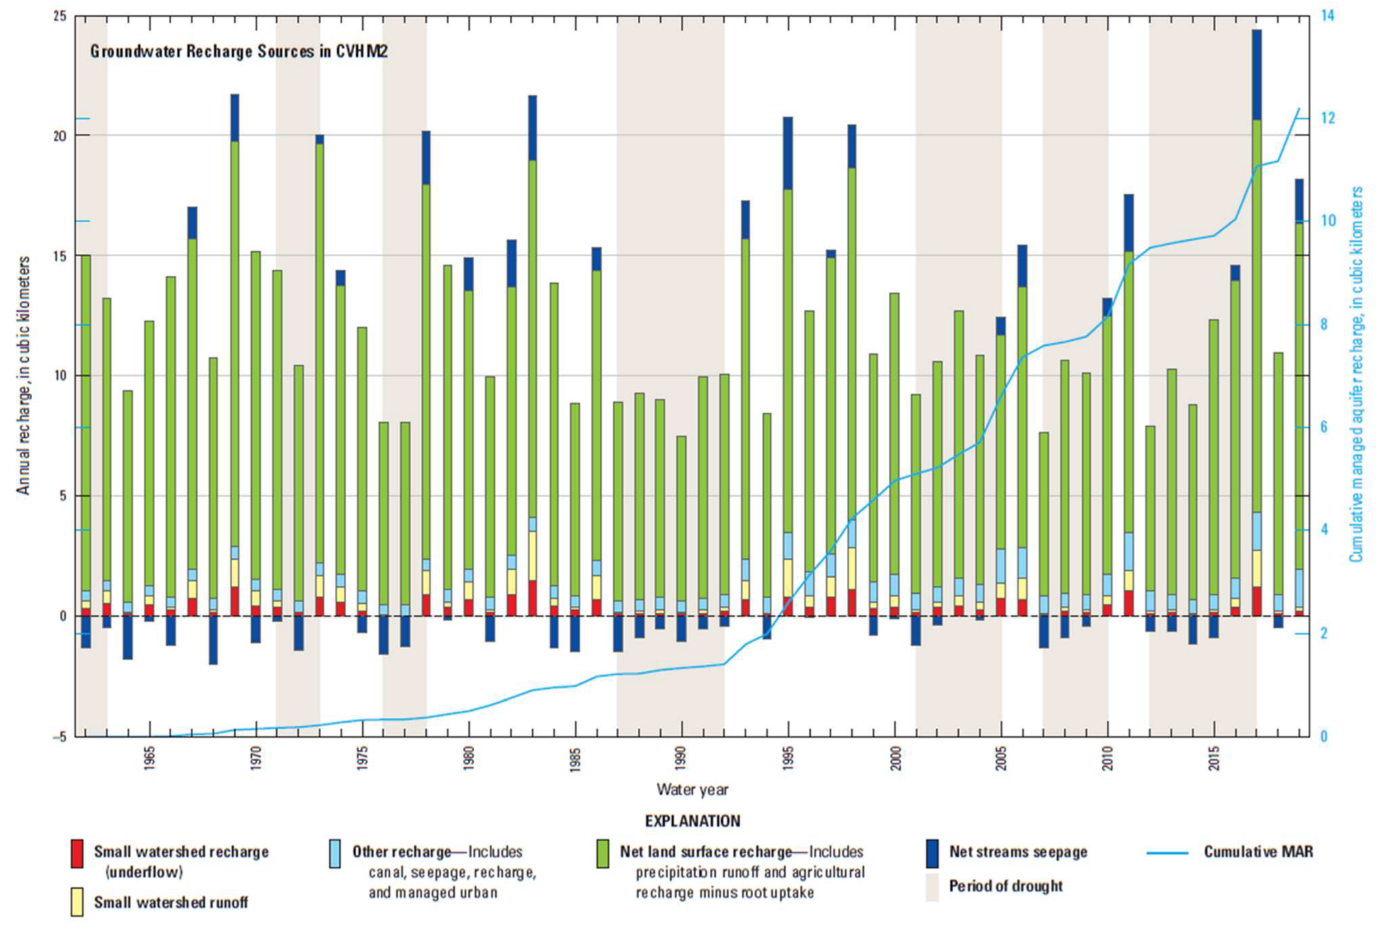
Managed aquifer recharge (MAR): Store excess SW in depleted aquifers during wet periods and extract it during droughts. Simulated total MAR ~ 12 km3 (1960s to 2019) (Fig. 4)
Irrigation Districts (e.g., Arvin Edison Water Storage District, Kern Water Bank) manage water in this way, using spreading basins to recharge aquifers.
AgMAR or FloodMAR involves flooding fields during non-growing season to recharge underlying depleted aquifers.
Central Valley Hydrologic Model:
1 square mile grid, 20,000 mi2 area from Sacramento to Bakerfield.
13 layers, top 5 above Corcoran Clay, 3 representing the confining clay, and underlain by 5 layers
Monthly stress periods
Land use maps with dominant crop per mi2 drives the water budget.
Water demand estimated based on crop water demand and irrigation efficiency
Streams simulated as reservoir inflows. Additional small watershed inflows included in CVHM2.
Diversions from streams to 135 water accounting units (21 in the 2009 version)
Some water accounting units reflect MAR systems
Focus on subsidence along Delta Mendoza Canal
SGMA greatly improved data access, some pumping data, increased GW level data.
Aquifer depletion: 1962 -2019: 158 km3
Many of the GSAs rely on MAR to move toward more sustainable management but there are concerns about double or triple counting the water and flow out of the aquifer back in to the surface water portions of the system.
Subsidence:
Joe Poland, 9 m of subsidence 1925 – 1977 SW of Mendoza
El Nido, 2.5 m, 1965 – 2016
Subsidence impacting canal systems.
Subsidence reflects permanent loss of aquifer storage: model estimates 15% of aquifer storage from compaction, inelastic, will not recover.
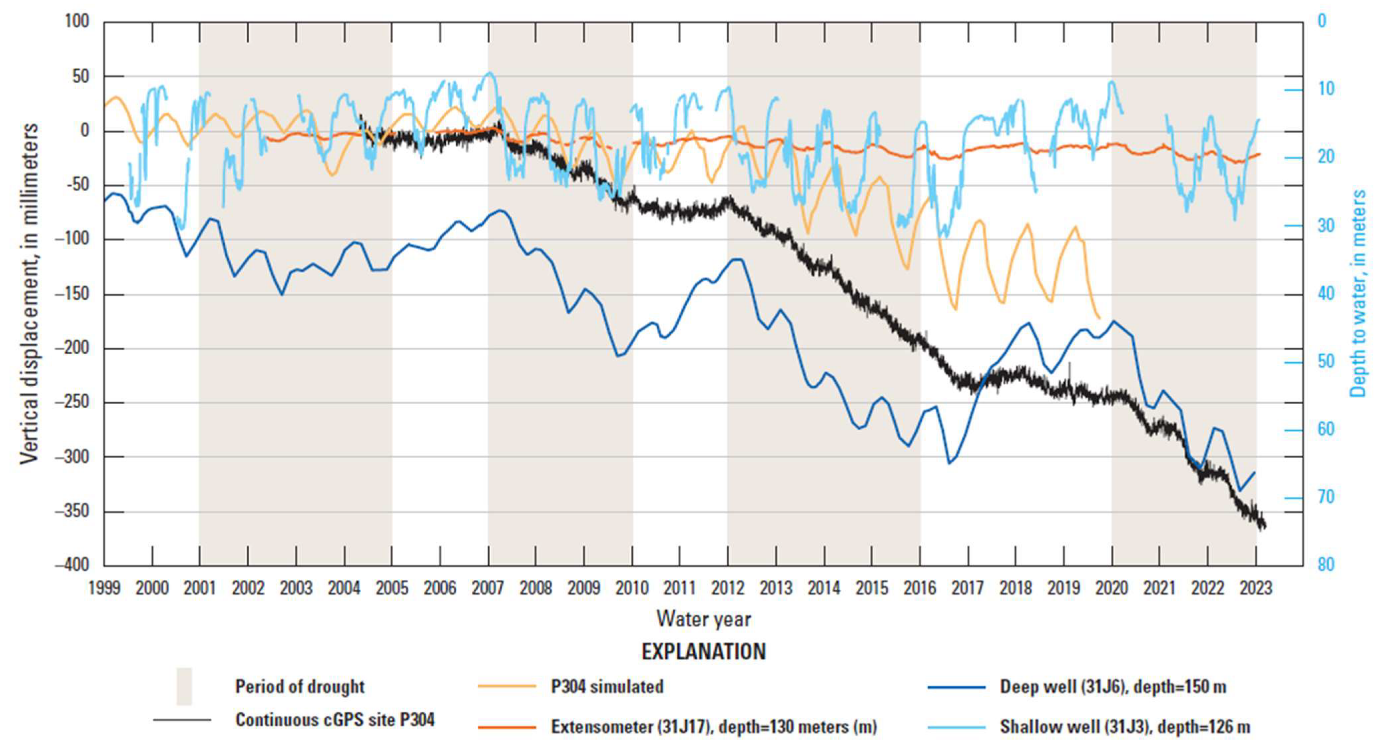
Subsidence occurs mostly during droughts (Fig. 5).
Airborne Electromagnetic Mapping: Knight et al., GW, 2018.
3 D mapping to depths of ~300 m, validated with geologic logs. Mapping paleochannels can help manage aquifer.
Agriculture $50 B industry in 2019;
GW pumping, only 20% from aquifer storage, remaining 80% from recharge processes (stream leakage, inefficient irrigation).
