Listen here on Spotify | Listen here on Apple Podcast
Episode released on August 22, 2024
Episode recorded on April 22, 2024
 Cath Moore is a Principal Scientist/Groundwater Modeler at GNS Science (originally Institute of Geological and Nuclear Science) in New Zealand
Highlights | Transcript
Background on New Zealand:
- Long narrow country (2 islands) in S Pacific, max. width: 450; max. length: 1600 km (270,000 km2)
- Climate: temperate, subtropical in North to inland alpine areas in South.
- Population 5.5 million people, 75% in N Island and 25% in S Island.
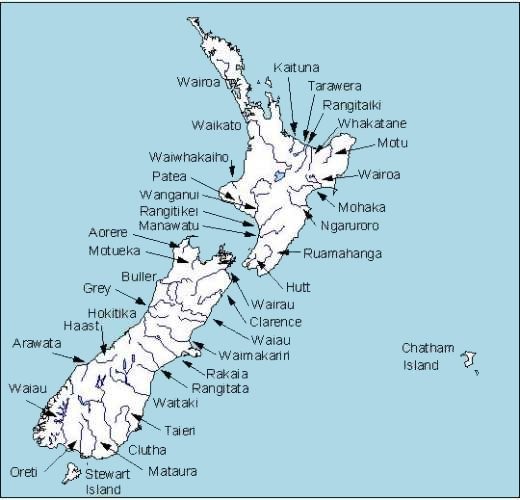
- Location at boundary between Pacific and Australian tectonic plates = lot of tectonic activity (earthquakes and volcanoes). N Island subduction zone: volcanic plateau, rivers flow from central plateau to coast, Waikato and Whanganui. S Island large rivers from Alps to E coast: e.g., Clutha and Taieri rivers.
- Large elevation difference in S Island: ~ 4 km from the Alps to to alluvial plains with glacial gravels.
- Precipitation: 250 mm (E side S Island) to 6 m (Milford Sound) to 10 m in S Alps.
- Agriculture: 70% of exports, mostly dairy recently and traditionally sheep (water ~11% of GDP) (New Zealand Our Land).
- Floods mostly on W coast and droughts mostly on E coast
- Cyclone Gabriel, floods 2023 E Coast and 2024 droughts in this region.
- Historically: 1870 big drought followed by big flood (1878).
- Atmospheric rivers account for 94% of extreme rainfall (Shu et al., 2021, Nature Sci Rept.).
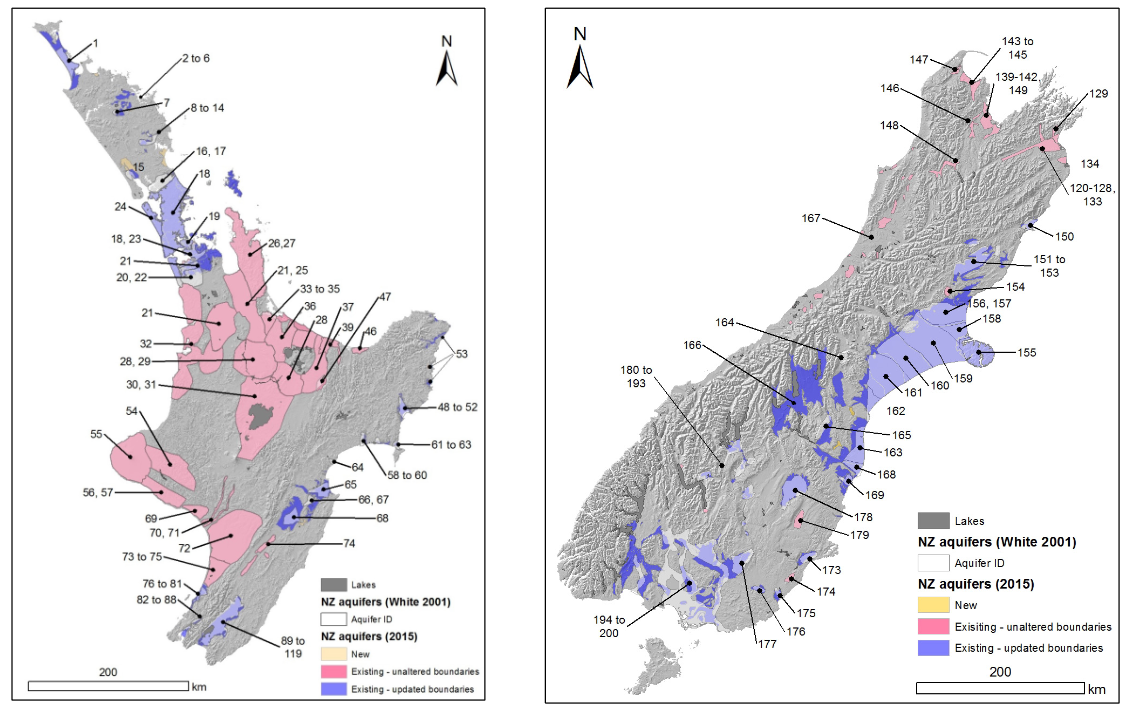
Aquifers: Groundwater (GW) is very important: 200 aquifer systems (Fig. 1)
- Canterbury Plains, S Island, alluvial gravel system, ≤2 km deep, water velocities ≤100 m/day.
- Limestone karst aquifers, localized, high productive
- Volcanic aquifers (e.g., near Auckland, basalts) and large ignimbrite aquifers.
- Some rivers straightened out to reduce flooding in plains but also reduce aquifer recharge, making a tradeoff between flood protection and drought prevention.
- Aquifers vulnerable to contamination, e.g., Havelock North (Hawkes Bay, pathogen outbreak in N Island, like Walkerton outbreak in Canada (Gilpin et al., J. Infection; 2020). Built Havelock Water Center to demonstrate advanced treatment (glassed, transparent), chlorinating and applying UV treatment, educational resources (link)
- Rural areas, groundwater not treated, septic tanks, susceptible to pathogens (e.g., campylobacter).
Mapping aquifers: airborne geophysics, SkyTEM system, past few years, airborne electromagnetic system, penetration depth ~ 300 m (e.g., Hawke’s Bay, Ruamahanga Valley Aquifers)
- Mapped six regions currently, including Tonga Planes, Mahana Planes in Northland
- Heretaunga Plains (Hawkes Bay): Airborne EM confirmed major fault with 300 m drop off in basement and evidence for offshore flow (high permeability channel).
- Need to demonstrate return on investment: economic benefits of having airborne data, using hydro-economic modelling for this.
Chemical and isotopic data used to conduct forensics and validate conceptual models of flow system.
- Tritium Lab at GNS, most accurate lab globally based on blind samples from IAEA (GNS: Tritium and Water Dating Lab.). Low bomb 3H levels in S hemisphere and the labs accuracy make Tritium an important natural groundwater age tracer in the S hemisphere.
- Bayesian chemistry assisted baseflow assessment method: looking at sources of N and P entering surface water (BACH; Woodward and Strenger, SERRA, 2018).
- Using BACHS (Bayesian Assisted Chemical Hydrograph separation) we explored how much does groundwater contribute to surface water from low to high flows: GW found to contribute ~ 90% of river flow based on analysis of 56 catchments, these results were significantly greater than anticipated and suggest groundwater flow, including groundwater recharge of surface water the biggest component of NZ water resources.
- GW and SW regulations connected: stream depletion considered in GW consents.
- Groundwater Modeling:
- Designing models specifically to support decisions (Doherty and Moore, Groundwater, 2020, https://gmdsi.org/). This requires fast running targeted modeling, as need to run many simulations to estimate uncertainty to conduct risk assessment. For this we use PEST (Parameter ESTimation) and uncertainty quantification (Doherty 2015, https://pesthomepage.org/pest-book, White et al., Groundwater, 2020). To make the process more cost effective we are developing ways to build these models rapidly: automating data downloads from geologic databases, GW levels, pumping data, streamflow data.( https://www.gns.cri.nz/research-projects/te-whakaheke-o-te-wai/)
Example applications:
- Currently Incorporating SkyTEM data and isotopes to reduce uncertainty.
- Hawkes Bay, with a local Maori community, we use long term records, and explore when SW and GW were highly connected and when it changed to now being disconnected. This focused on a horticultural and viticultural area, Bridge Pa Triangle, famous for Paritua wines.
- The model was being used to answer the question: could we restore streamflow?
- Historical maps and archives were used in a model designed to explore stream restoration scenarios of a local Māori community based on the goals defined through catchment hindcasting (e.g. how the catchment has changed over time).
- This involved modeling of a catchment biography from pre-European times to now, using snapshot models of different periods.
- These periods included deforestation, dike irrigation, GW fed irrigation, GW depletion disconnecting SW from GW. Finally, this model is used to explore river restoration, with a greater understanding of the surface-water groundwater system dynamics now possible through this catchment biography.


