Listen here on Spotify | Listen here on Apple Podcast
Episode released on May 30, 2024
Episode recorded on March 5, 2024
 Clint Dawson is the leader of the Computational Hydraulics Group at the Oden Institute at the University of Texas.
Highlights | Transcript
- Clint has been involved with the ADCIRC (Advanced Circulation) storm surge model for other 30 years working with Joannes Westerink (Univ. Notre Dame) and Rick Luettich (Univ. N Carolina).
- Clint’s work speeded up the running of ADCIRC > 100× by running the code on high performance computers (HPC), such as those at Texas Advanced Computing Center (TACC), parallelizing the code using many processors (~100) and unstructured grids (1 km resolution in ocean to 10s m inland).
- Increased speed allowed modeling of much larger area, now running globally and for operational use.
- Examples of recent hurricanes that ADCIRC was used to model include IAN (Fort Meyers, Florida, 2022, IDA (2021), and Laura (2020) landfalling in Louisiana and Harvey in Texas in 2017. Many of these hurricanes generated storm surges up to ~10 ft height.
- An archive of hurricane storm tracks available through the CERA (Coastal Emergency Risks Assessment) Historical Storm Archive.
- In operational forecasting mode: ADCIRC uses the wind speed and best storm track data from the National Hurricane Center which are provided every 6 hr (Fig. 1). The ADCIRC Surge Guidance System develops nowcasts in very short time (minutes) and then forecasts for up to 5 days within 1 – 2 hr.
- In hindcasting mode: ADCIRC is used to simulate storm surge using the actual storm track and wind speed data (reanalysis wind fields) and data assimilation to provide the best simulation of what happened during a hurricane.
- Output from hurricane forecasts and hindcasts are used by state emergency management groups (Texas State Operations Center), Federal Emergency Management Agency (FEMA), and the Federal Government to determine if there will be a Disaster Declaration, and insurance agencies etc.
- Factors controlling storm surge include (a) storm intensity, (b) wind speed, (c) size (radius of maximum winds-RMW), (d) angle of approach to the coast, (e) tides (high tide amplifies and low tides partially mitigates surge), (f) shape and characteristics of coastal features, such as bays and estuaries, and (g) width and slope of continental shelf. Waves and tidal currents can amplify the effects. (Link) During summer ocean expands with warming that could increase height by up to 1 ft.
- Storms classified according to windspeed:
- Tropical cyclones: winds ≤38 miles per hour (mph)
- Tropical storms: winds 38 – 73 mph
- Hurricanes: 5 categories, category 5 ≥157 mph.
- A 6th category is being proposed.
- Tropical cyclones: winds ≤38 miles per hour (mph)
- Classification scheme for storms based primarily on windspeed may not be optimal in terms of estimating impacts or damage. For example: Hurricane Ike (2008), category 2, huge damage because of large wind field pushed water into heavily populated area in Galveston Island (12 – 15 ft storm surge across Harris county; 1.2 – 1.5 million people evacuated, $27 B damages (link)). Storm windspeed and radius are both very important for assessing potential impacts.
- Maybe a better predictor of storm surge impacts could be the kinetic energy of a storm.
- As hurricane category increases radius of maximum winds generally decreases so higher category hurricanes tend to be much more localized.
- Risk assessment: Hazard, exposure, and vulnerability.
- Compound events include storm surge and pluvial (from rain) and fluvial (riverine) flooding.
- Hurricane Harvey good example of compound event: storm surge was up to 10 – 12 ft high and 40 – 60 inches of rain fell because it stalled resulting in intense pluvial and fluvial flooding. Brazos river gage at Richmond crested at 55 ft. Fluvial flooding so large it crossed river basins. Texas coast extremely flat, nowhere for water to go. Flood waters take a long time to recede.
- Hurricane Katrina (2005), New Orleans category 5 storm, 1836 fatalities, almost $100 billion in damages because of failure of the levee system. Katrina highlighted the need for much more intensive research in storm surge and resulted in marked advances in ADCIRC program.
- Examples of other codes used for hurricane forecasts include:
- SLOSH (Sea Lake and Overland Surges from Hurricanes, National Hurricane Center), rapid simulations, simplifying assumptions, is used operationally
- SCHISM (Semi-implicit Cross-scale Hydroscience Integrated System Model), compound flooding
- DELFT3D, by Deltares, not used operationally, includes hydrodynamic (DELFT3D Flow), morphodynamic, waves, water quality and particle modeling
- SFINCS (SuperFast Inundation of CoastS) (Deltares) used to simulate compound flooding rapidly
- SLOSH (Sea Lake and Overland Surges from Hurricanes, National Hurricane Center), rapid simulations, simplifying assumptions, is used operationally
- DesignSafe, funded by the National Science Foundation through the Natural Hazards Engineering Research Infrastructure, or NHERI, program is used to run multiple ensembles and archive model output. ADCIRC modeling in DesignSafe is described in this webinar.
- ADCIRC is also used for infrastructure design to reduce storm surges. An example includes the Ike Dyke or coastal spine. An additional system inside Galveston Bay (islands and gages) proposed to further protect W Galveston Bay and oil and gas infrastructure etc.
The ADCIRC community began with 5 – 10 researchers in the late 1990s and early 2000s and has evolved to ~100 researchers with incredible achievements considering limited academic budgets.
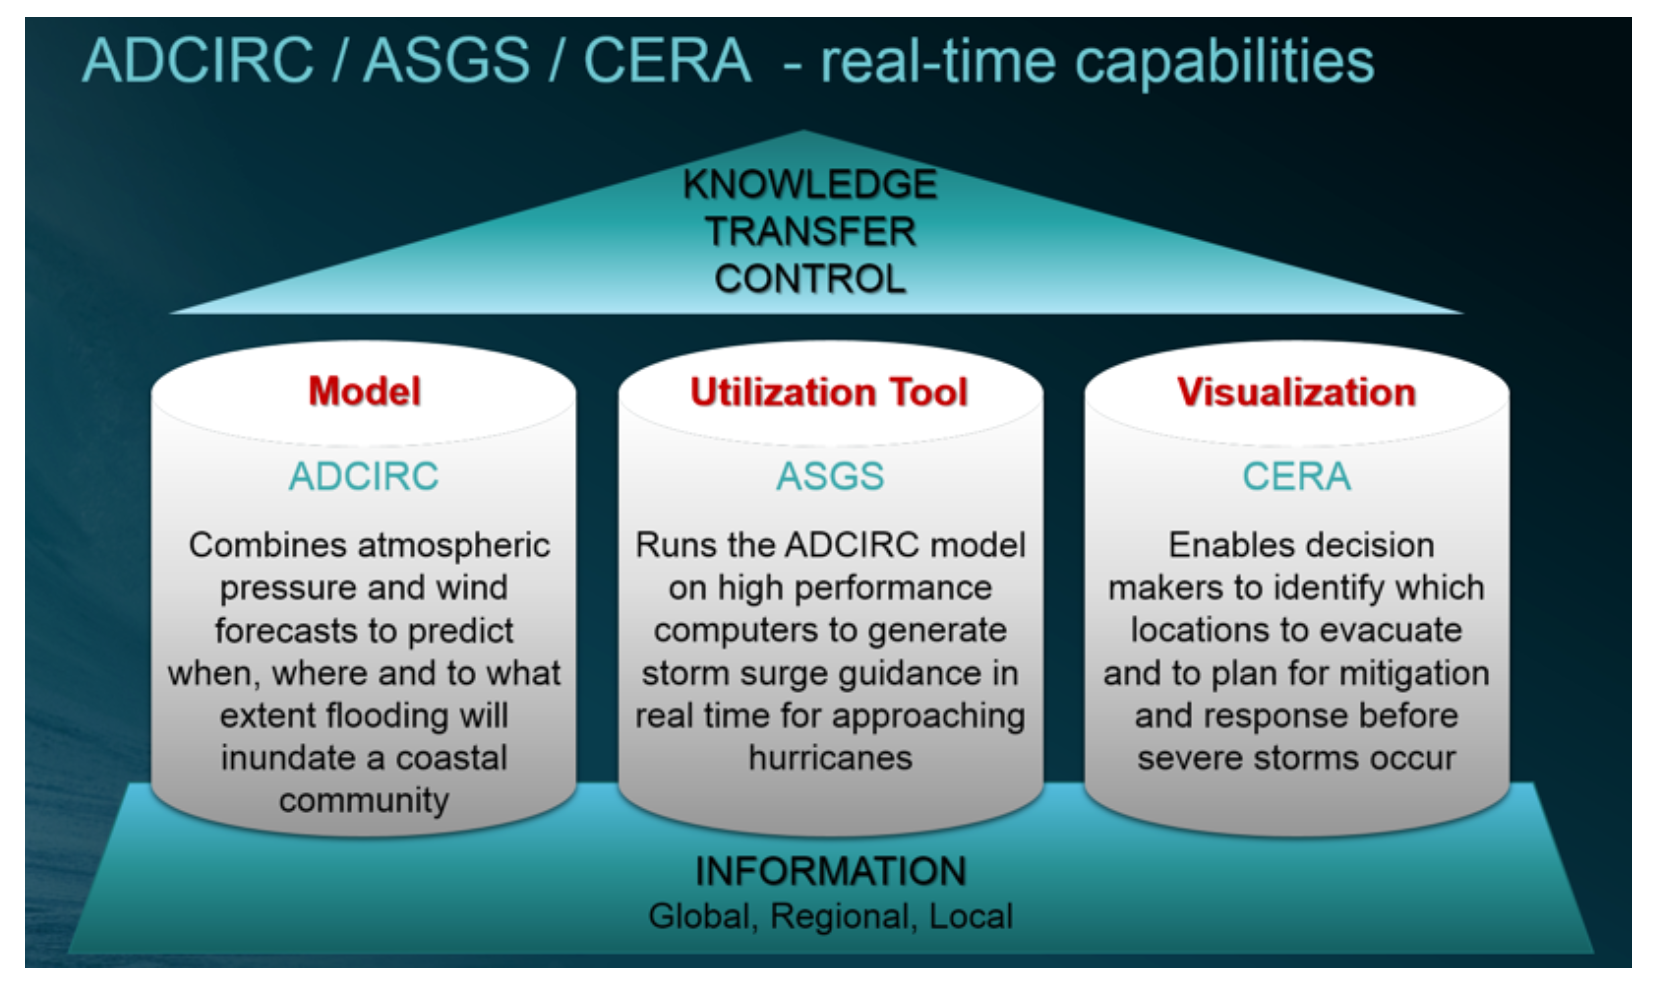
Figure 1. Approach used in operational storm surge forecasting using ADCIRC to model surge based on storm track and wind speed provided by National Hurricane Center. The ADCIRC Surge Guidance System runs ADCIRC and generations surge guidance. Visualization is provided by CERA to emergency managers and others. 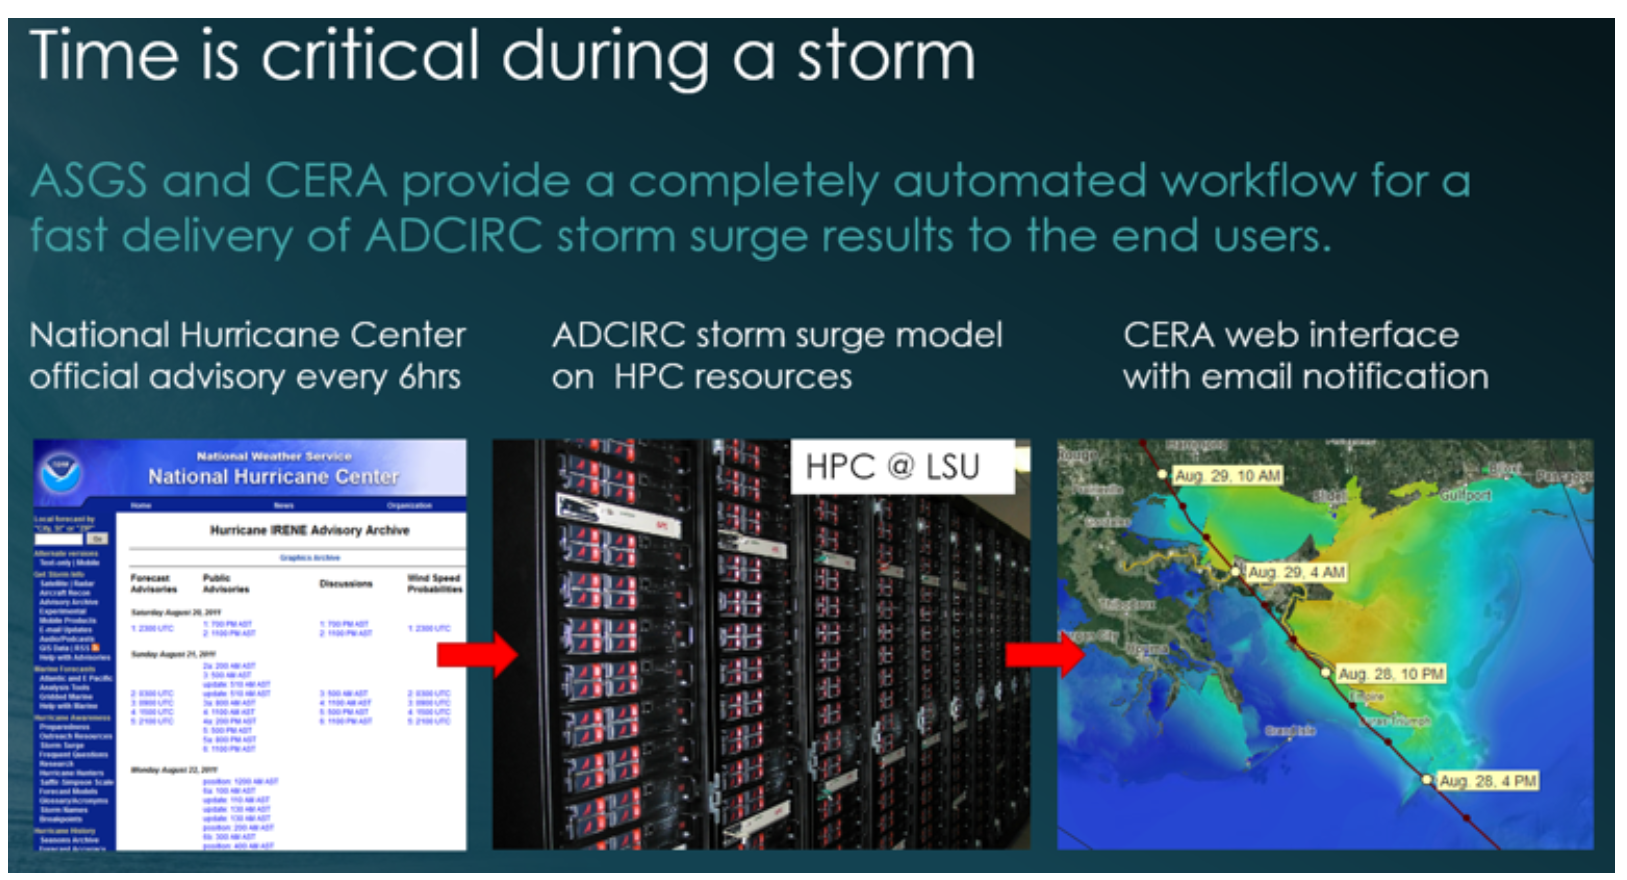
Figure 2. ADCIRC is run all the time with the workflow entirely automated, including data collection from various sources and output provided in different formats to many agencies. The CERA web mapper provides output in usable formats.

