Listen here on Spotify | Listen here on Apple Podcast
Episode released on April 18, 2024
Episode recorded on November 20, 2023
 Matt Rodell is the Deputy Director of Earth Science for the Hydrosphere, Biosphere, and Geophysics at NASA Goddard Space Flight Center.
Highlights | Transcript
GRACE (Gravity Recovery and Climate Experiment) satellites monitor changes in Terrestrial Water Storage (TWS) from the atmosphere to the Moho.
Monitoring changes in Earth’s gravity, GRACE satellites can monitor changes in water storage deep in the subsurface, unlike most other satellites that rely on reflected or emitted wavelengths and monitor in top ~ 5 cm.
Changes in TWS reflect variability in response to droughts, floods, reservoir filling (Three Gorges), and groundwater depletion because water is heavy.
Original GRACE mission launched March 2002 and ended in 2017. GRACE-Follow On mission launched in May 2018 (11 month gap with 1st mission).
Best way to monitor changes in TWS is to use two identical satellites tracking each other, ~ 200 km apart and launched ~ 500 km above land surface.
Monitoring intersatellite distances at micrometer resolution using microwave (GRACE) or laser (GRACE-FO) ranging enables mapping of TWS anomalies at monthly timescales.
GRACE satellites cannot measure absolute water storage but do estimate changes in water storage .
TWS is sum of snow, ice, surface water, soil moisture, and groundwater.
Hydrologists were originally skeptical of the value of GRAC because of coarse resolution (150,000 km2), similar to the size of Illinois.
Data latency is ~ 3 months.
GRACE data provide global coverage of TWS anomalies, and they are spatially and temporally continuous.
TWS was designated an Essential Climate Variable by the Global Climate Observing System in 2023 (1 out of 54 variables). TWS is valuable because it integrates all of the water storages.
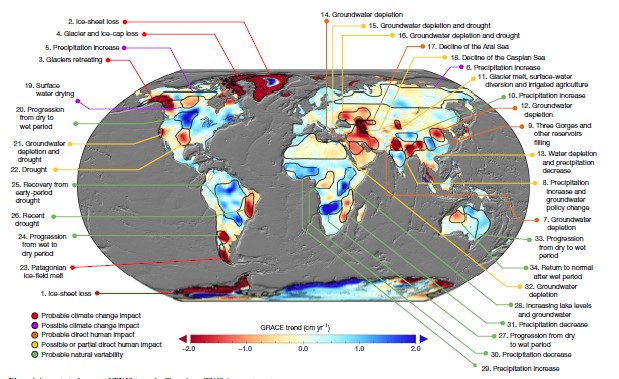
Rodell et al., Nature (2018) describes linear trends in GRACE TWS and attributes these trends to
- natural variability (e.g., droughts, floods)
- climate change (e.g, ice sheet and glacier melting)
- direct human impacts (e.g., aquifer depletion, NW India, Central Valley, High Plains)
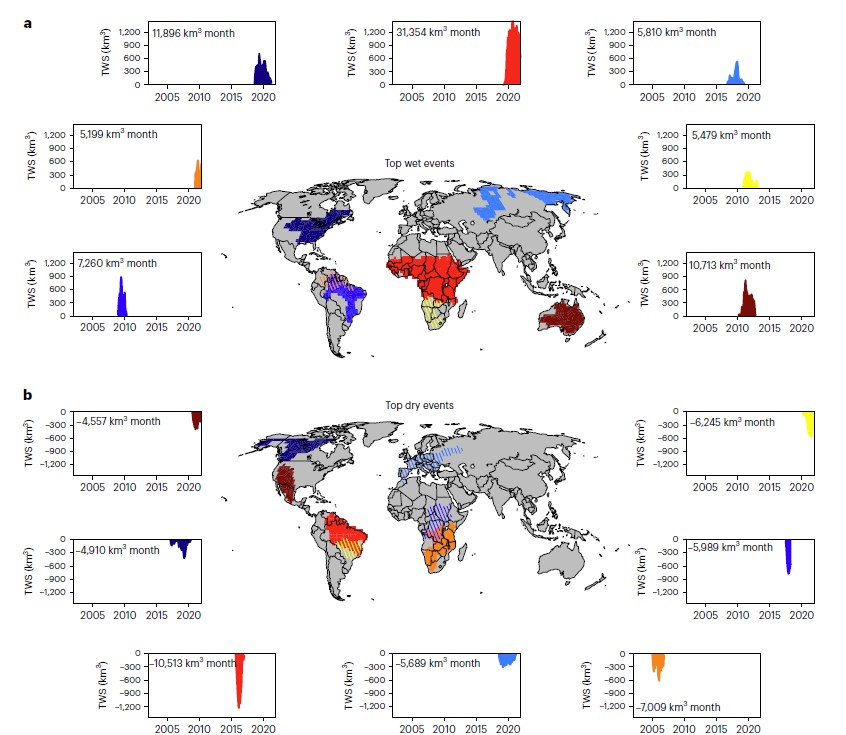
In Rodell’s paper on Changing intensity of hydroclimatic extreme events he showed about an equal number of wet events (~500) and dry (~500) events, the biggest being a wet event in Central Africa with an intensity of ~ 30,000 km3 months.
Extreme events: challenge for water resource managers to maintain consistent water supplies.
Main driver of changes in global total intensity of extreme water cycle events was found to be the global mean temperature.
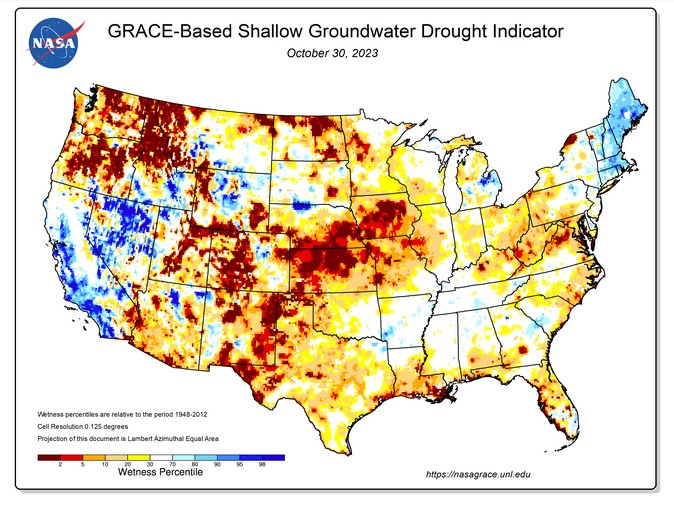
Drought monitor product for US based on GRACE data to constrain a land surface model is used in the US Drought Monitor. The resultant wetness indicator (weekly) helps put water storage within long-term context (1948 – 2023) for shallow aquifers, root zone, and surface soil moisture.
Reager et al. (2014) also suggested a Flood Potential Index.
Early work emphasized groundwater depletion in NW India (Rodell et al., 2009). GRACE also played a critical role in quantifying drought impacts in the Central Valley and in passing of California’s Sustainable Groundwater Management Act in 2014.
One of five missions proposed by the National Academy of Sciences that should be launched over the next decade is a Mass Change mission, renamed GRACE C for continuity. GRACE C would be similar to GRACE and GRACE FO, launch in 2028 to a 500 km altitude and polar orbit.
There are also discussions of combining GRACE C with a pair of European satellites called Next Generation Gravity Mission (NGGM) which would be launched in 2032 at 400 km (higher resolution) at 65° inclination
The combination of GRACE-C and NGGM would be called MAGIC (Mass-Change and Geosciences International Constellation), and it would enable improved spatial and temporal resolutions.
Research is also being conducted on Quantum Gravity, a satellite technology that would use a free-floating cloud of atoms to measure gravitational forces (could provide much higher resolution than GRACE-C).