Listen here on Spotify | Listen here on Apple Podcast
Episode recorded on August 14, 2023
Episode released on December 28, 2023
 Chunmiao Zheng is Chair Professor in the School of Environmental Science and Engineering in Southern University of Science and Technology (SUSTech) in Shenzhen. He is also Chair Professor and Vice President of a new private startup university called Eastern Institute of Technology (EIT) in Ningbo, China.
Highlights | Transcript
- China is repeatedly subjected to floods and droughts. Beijing in July 2023 experienced 1:100 yr flood. Economic costs of floods in 2020 totaled an estimated $15 bn and droughts $7.6 bn (AON, 2023). These extremes are challenging for water resource managers.
- Background:
- China ~ 1.4 bn people, similar to India and Africa but much higher than US (0.3 bn);
- China Area: 9.6 million (M) Km2; higher than India (3.6 M km2) and similar to US (9.8 M km2) and Canada (10 M km2)
- Population in China peaked in 2022 and stopped growing.
- China tale of two halves in terms of water resources with dividing line at border of Yellow/Yangtze rivers:
- N half: water poor, average precipitation <200 mm/yr (~8 in/yr)
- S half: water rich, average precipitation >1600 mm/yr (~64 in/yr)
- Water resources per capita N vs S is 1:4.
- Solutions to spatiotemporal disconnects between water supply/demand:
- Three Gorges Dam evens out water supply variability, reducing flooding and providing water during droughts: dam 181 m high, capacity 39 km3, slightly larger than Lake Mead (32 km3) and Lake Powell (30 km3) in the US. TGD is also worlds largest hydroelectric plant (capacity 22,500 MW)
- South to North Water Diversion (SNWD) project:
- Transfer up to 45 km3 of water from Yangtze River to the semiarid north
- Eastern Route: upgrade Grand Canal, divert > 10 km3 of water, water to Shandong, Tianjin. Length ~ 1,150 km; 65 m lift, 13 pumping stations
- Central Route: Grand Aqueduct, divert ~10 km3 from Danjiangkou Reservoir to Beijing; Length ~1,264 km, gravity fed.
- Western Route: being considered.
- Groundwater recovering in North China Plain: previous depletion with groundwater levels declining from 3 – 4 m below land surface to 50 – 60 m deep with subregional recovery since 2014 (Zhang et al., JoH, 2021).
- China accounts for less than 10% of global arable land (FAO) and about 6% of global water resources but feeds almost 20% of global population.
- China has relaxed it’s emphasis on national food security and is more heavily reliant on imports.
- China has been a net importer of agricultural products since 2004. China’s food self-sufficiency decreased from 94% in 2000 to 65% in 2020.
- Net imports of agricultural products totaled $84 bn in 2020, mostly from Brazil ($33 bn), US ($25 bn). (Resourcetrade.earth).
- Changing diet with improved economic development contributing to increasing food demand.
- Water footprint of imported food saves water in China.
- Professor Wolfgang Kinzelbach has been working with farmers in the North China Plain to develop a path toward sustainable agriculture through monitoring of water use (electricity use as proxy), water pricing, and groundwater models feeding into decision support system (Kinzelbach et al., 2022).
- Water governance impacted by the nine-dragon rule of waters (i.e., too many cooks spoil the broth). Chinese former Premier Li Keqiang signed the Regulation on Groundwater Management to coordinate efforts among ministries, including groundwater quantity and quality (Zheng and Guo, 2022).
- Examples of detailed hydrologic studies include:
- Integrated modeling combining ecohydrology and socioeconomics in the Heihe River Basin in NW China, an endorheic basin. A Chinese National Science Foundation Study over 8 years. Study includes increasing discharge from high mountain glaciers and permafrost melting with dry midsection attributed to intensive irrigation and drying up of terminal lake (Juyan Lake). Conjunctive use of surface water during wet periods and limited groundwater use to dry periods in midsection. Study results helped government managers modify existing water sharing compact agreements between mid and downstream communities. (Li et al., 2021; Sun et al., 2018)
- Loess Plateau: Green for Grain (GFG) Program in China, initiated in 1999 by Chinese Government to address deforestation, overcultivation, and soil erosion. Results: runoff reduced from 8% of precipitation (1980 – 1999) to 5% (2000 – 2020). Afforestation reduced groundwater recharge, groundwater discharge (baseflow) to Yellow River. High soil erosion resulted in build up of Yellow River, now greatly reduced, worried about sediment starved system downstream (Zhao et al., 2021; Chen et al., 2015).
- Asian Water Tower, Qinghai Tibet Plateau, headwaters for many major rivers (Yellow, Yangtze, Mekong) (Yao et al., 2021). Largest store of frozen water outside polar regions referred to as the Third Pole. Providing water to ~ 2 bn people. Warming ~ 0.4°C over ~40 yr (1980 – 2018), permafrost thawing (Ji et al., 2022), lake expansion in plateau (Zhang et al., 2020).
- Pollution: Surface water and groundwater pollution major challenges for China. An estimated 60% of all groundwater monitoring wells reported to be grade 4 or 5 in a 1 – 5 scale (1 high quality, 5 poor quality). But China has taken bold initiatives to address these challenges, in recent years unveiled 10-point water action plan, 10-point soil action plan, and 10-point air action plan. Example: Shenzhen, rivers heavily polluted, referred to as black smelly water bodies. $10 bn investment in 2015, greatly improved surface water quality since then.
- Economic concept, weak sustainability, develop economically, China 800 million people out of extreme poverty over past four decades (World Bank, 2022). Economic development, agricultural expansion, and industrialization degraded the environment but now China has the economic resources to address these environmental issues.
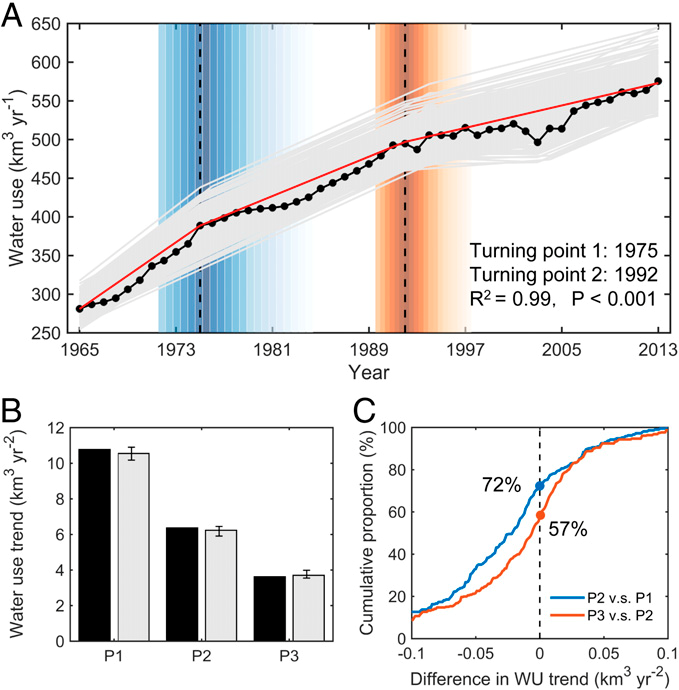
(A) National mean annual water use during 1965 to 2013 (black dots and line). The red line is the piecewise linear fit (R2 = 0.99; P < 0.001). Each gray line (N = 300) is a piecewise linear fit for a randomly selected subset (90%) of the prefectures. The piecewise linear regression model indicates two statistically significant turning points in 1975 and 1992 (dashed lines). The shaded areas indicate the interquartile of the estimated turning points derived from 300 resampling results.
(B) The water use trends before and after each of two turning points. The black and gray bars indicate the values from national mean annual water use and 300 resampling results, respectively. Error bars indicate standard deviation.
(C) Cumulative proportion of the differences in water use trends between P2 and P1 (blue line) and between P3 and P2 (orange line). The dashed line indicates no difference between two periods. Zhou et al., 2020, PNAS.

