Listen here on Spotify | Listen here on Apple Podcast
Episode recorded March 8, 2023
Episode released on May 4, 2023
 Mike Dettinger is a Senior Research Scientist at Scripps Institution of Oceanography in the Center for Western Weather and Water Extremes (CW3E).
Highlights | Transcript
- This podcast focuses on recent atmospheric rivers (ARs) (December 2022 through January 2023 in California and their impacts on water resources.
A sequence of up to 9 ARs made landfall in California over a three-week period (Dec. 26, 2022, through Jan 16, 2023). (Example Fig. 1, San Francisco, Integrated water Vapor Transport [IVT] peak in 1st AR, ~ 1000 kg/m/s). A high-pressure ridge dissipated in mid-December (2022) that prevented previous ARs from landfalling.
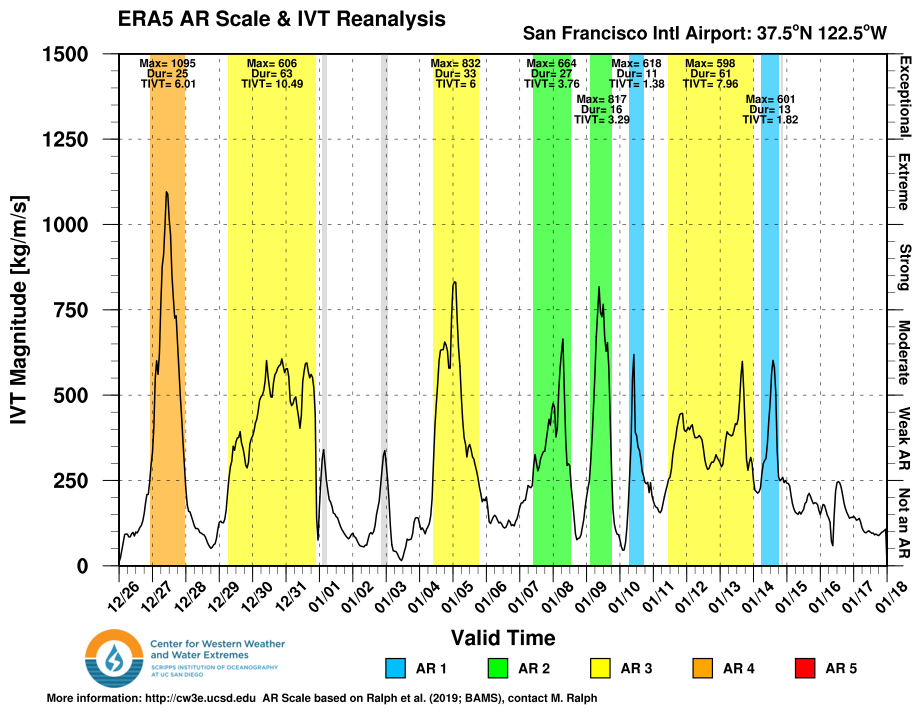
Figure 1. Time series of atmospheric rivers in San Francisco beginning on Dec. 26, 2022, through Jan. 16, 2023. - The first AR in San Francisco was classified as hazardous, ranked 4, others considered beneficial. Ranking system developed by Ralph et al., 2019, BAMS, ranging from 1 to 5 based on magnitude and duration of ARs. In Los Angeles, the last AR was the strongest.
According to the US Drought Monitor, the ARs ended the 3-yr meteorological drought in California (Fig. 2). Groundwater depletion has not recovered because it is related to overpumping and not to climate.
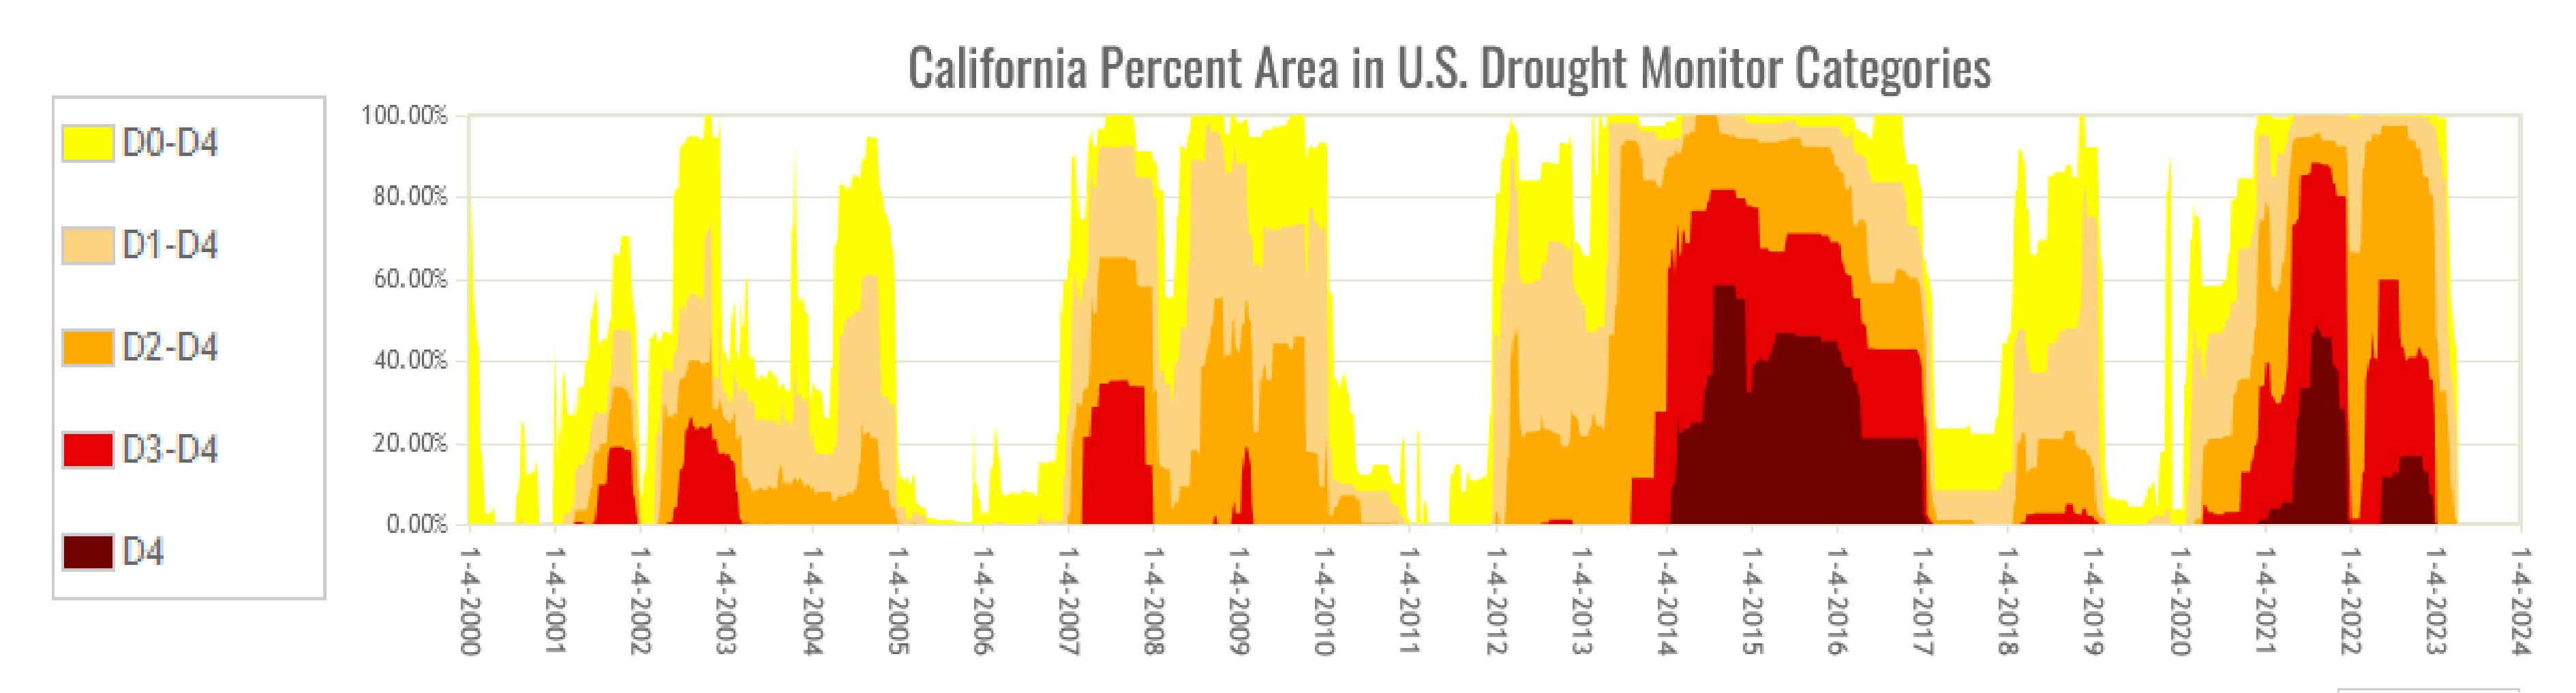
Figure 2. Time series of drought in California from the U.S. Drought Monitor, showing 5 yr drought (2012 – 2017) and recent 3 yr drought (2020 – 2023). Sharp declines in drought in January 2017 and 2023 reflect Atmospheric Rivers. The ARs were concentrated in the central third of California and the extreme north and south regions remained dry. All ARs followed a generally consistent path. California was about a year’s worth of precipitation behind over the past three drought years (2020 – 2023).
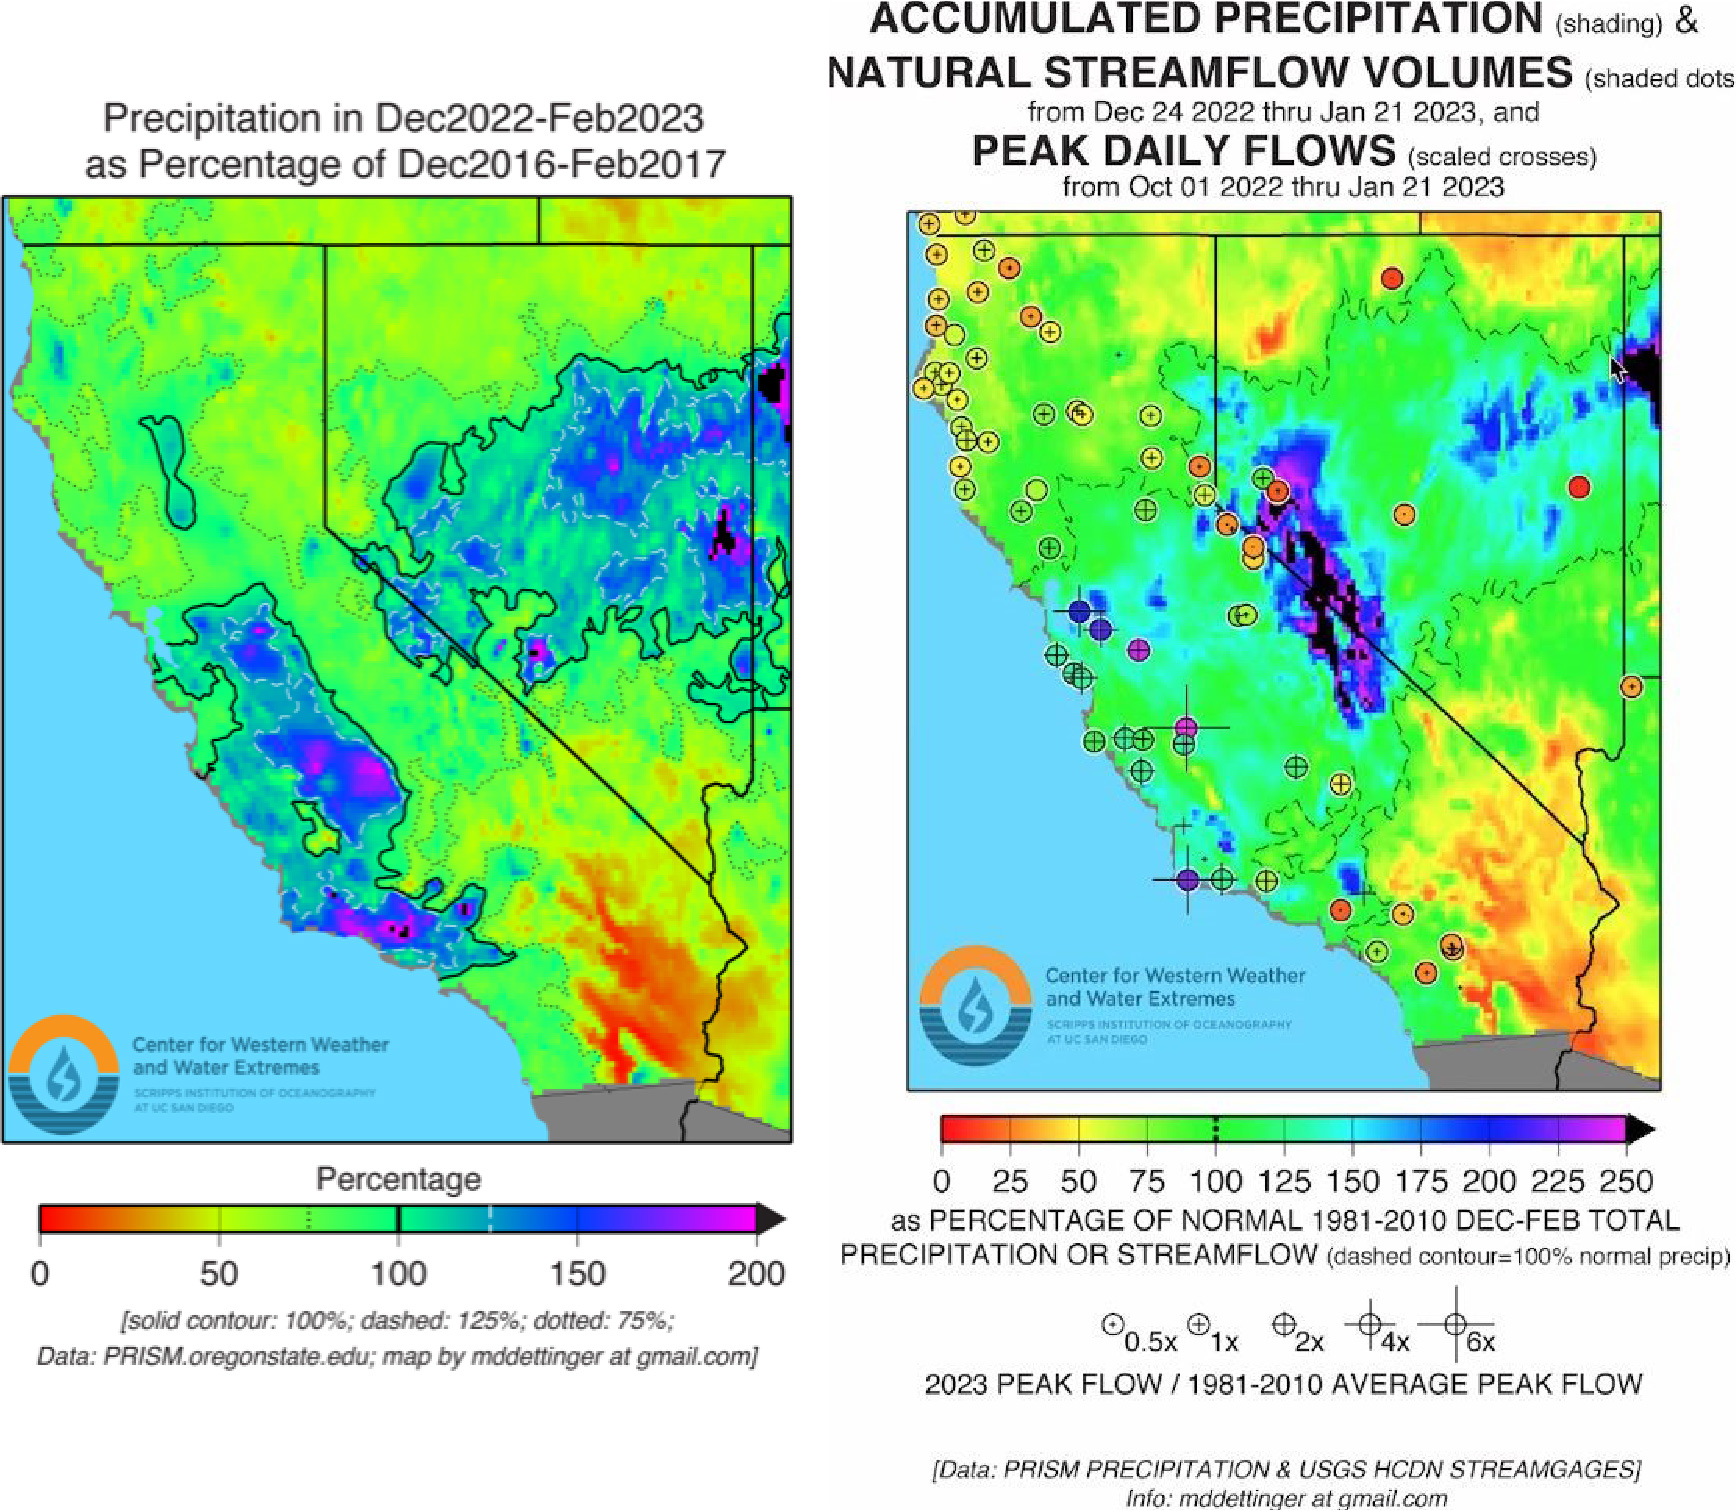
Figure 3. Map showing distribution of AR impacts on precipitation and precipitation and streamflow as a percentage of normal. The above maps show concentration of AR impacts in central third of the state, with low impact in the north and extreme south. - The ARs increased snowpack in the Sierra Nevada mountains, with California Department of Water Resources reporting that the snowpack is one of the largest ever, with statewide snowpack of ~240% of average for April 1. Snowpack ranges from 192% of normal in the Northern Sierra to 293% of normal in Southern Sierra on April 1, 2023. https://cdec.water.ca.gov/snowapp/sweq.action High snowpack levels in the Southern Sierras raise concerns about flooding in the Tulare Lake Basin.
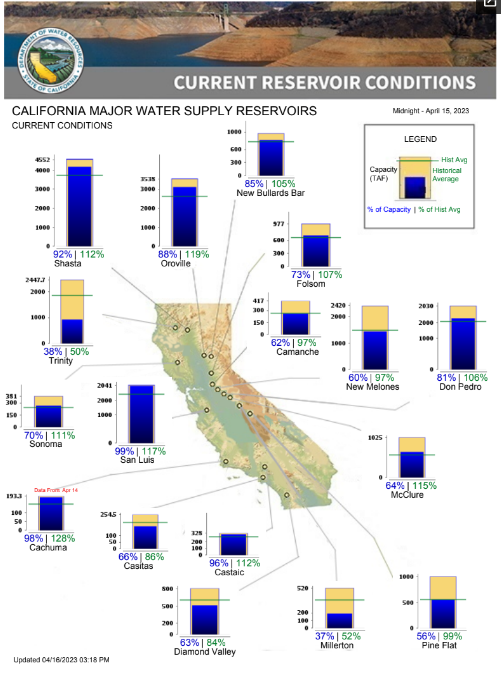
- ARs improved reservoir storage with reported values ranging from 88 – 92% of average capacity in the north (Shasta, Oroville) and highest levels in the central region (81-99% [Don Pedro, San Luis]) and lower in the south (37 – 63%, Millerton, Diamond Valley) based on download on Apr 16, 2023. https://www.farmwater.org/learn-more/cdeccaliforniareservrsoi/
- Elevated precipitation extended to Salt Lake Utah with weak rain shadowing in the Sierras.
- The forecast skill was good with tweets in mid-December 2022, about one week prior to the arrival of ARs.
- The ARs this winter are comparable to those in winter 2017 after the four-year drought in 2012 through 2016. A total of ~17 ARs fell over a few months in 2017. The 2017 ARs resulted in a spillway failure at Oroville Dam in northern California requiring evacuation of ~190,000 people and $1 billion in damages.
- Department of Water Resources increased the forecasted State Water Project (SWP) deliveries from N California to the Central Valley from 25% in February to 75% in April 2023 as a result of the increases precipitation and snowpack.

