Listen here on Spotify | Listen here on Apple Podcast
Episode released on April 03, 2025
Episode recorded on November 07, 2024

Dale Barrow is the Director of GEOSS in South Africa, a groundwater consulting company providing expertise in groundwater exploration and development.
Highlights | Transcript
“ Cape Town Day Zero” term was coined to represent the day when Cape Town would run out of water in 2015 to 2018 period (New York Times).
- Linked to drought (1 in 100 yr drought) related to El Nino conditions
- Cape Town not drought resilient because almost totally reliant on ~ six surface water reservoirs (Western Cape Water Supply System) (Fig. 1), with limited groundwater abstraction.
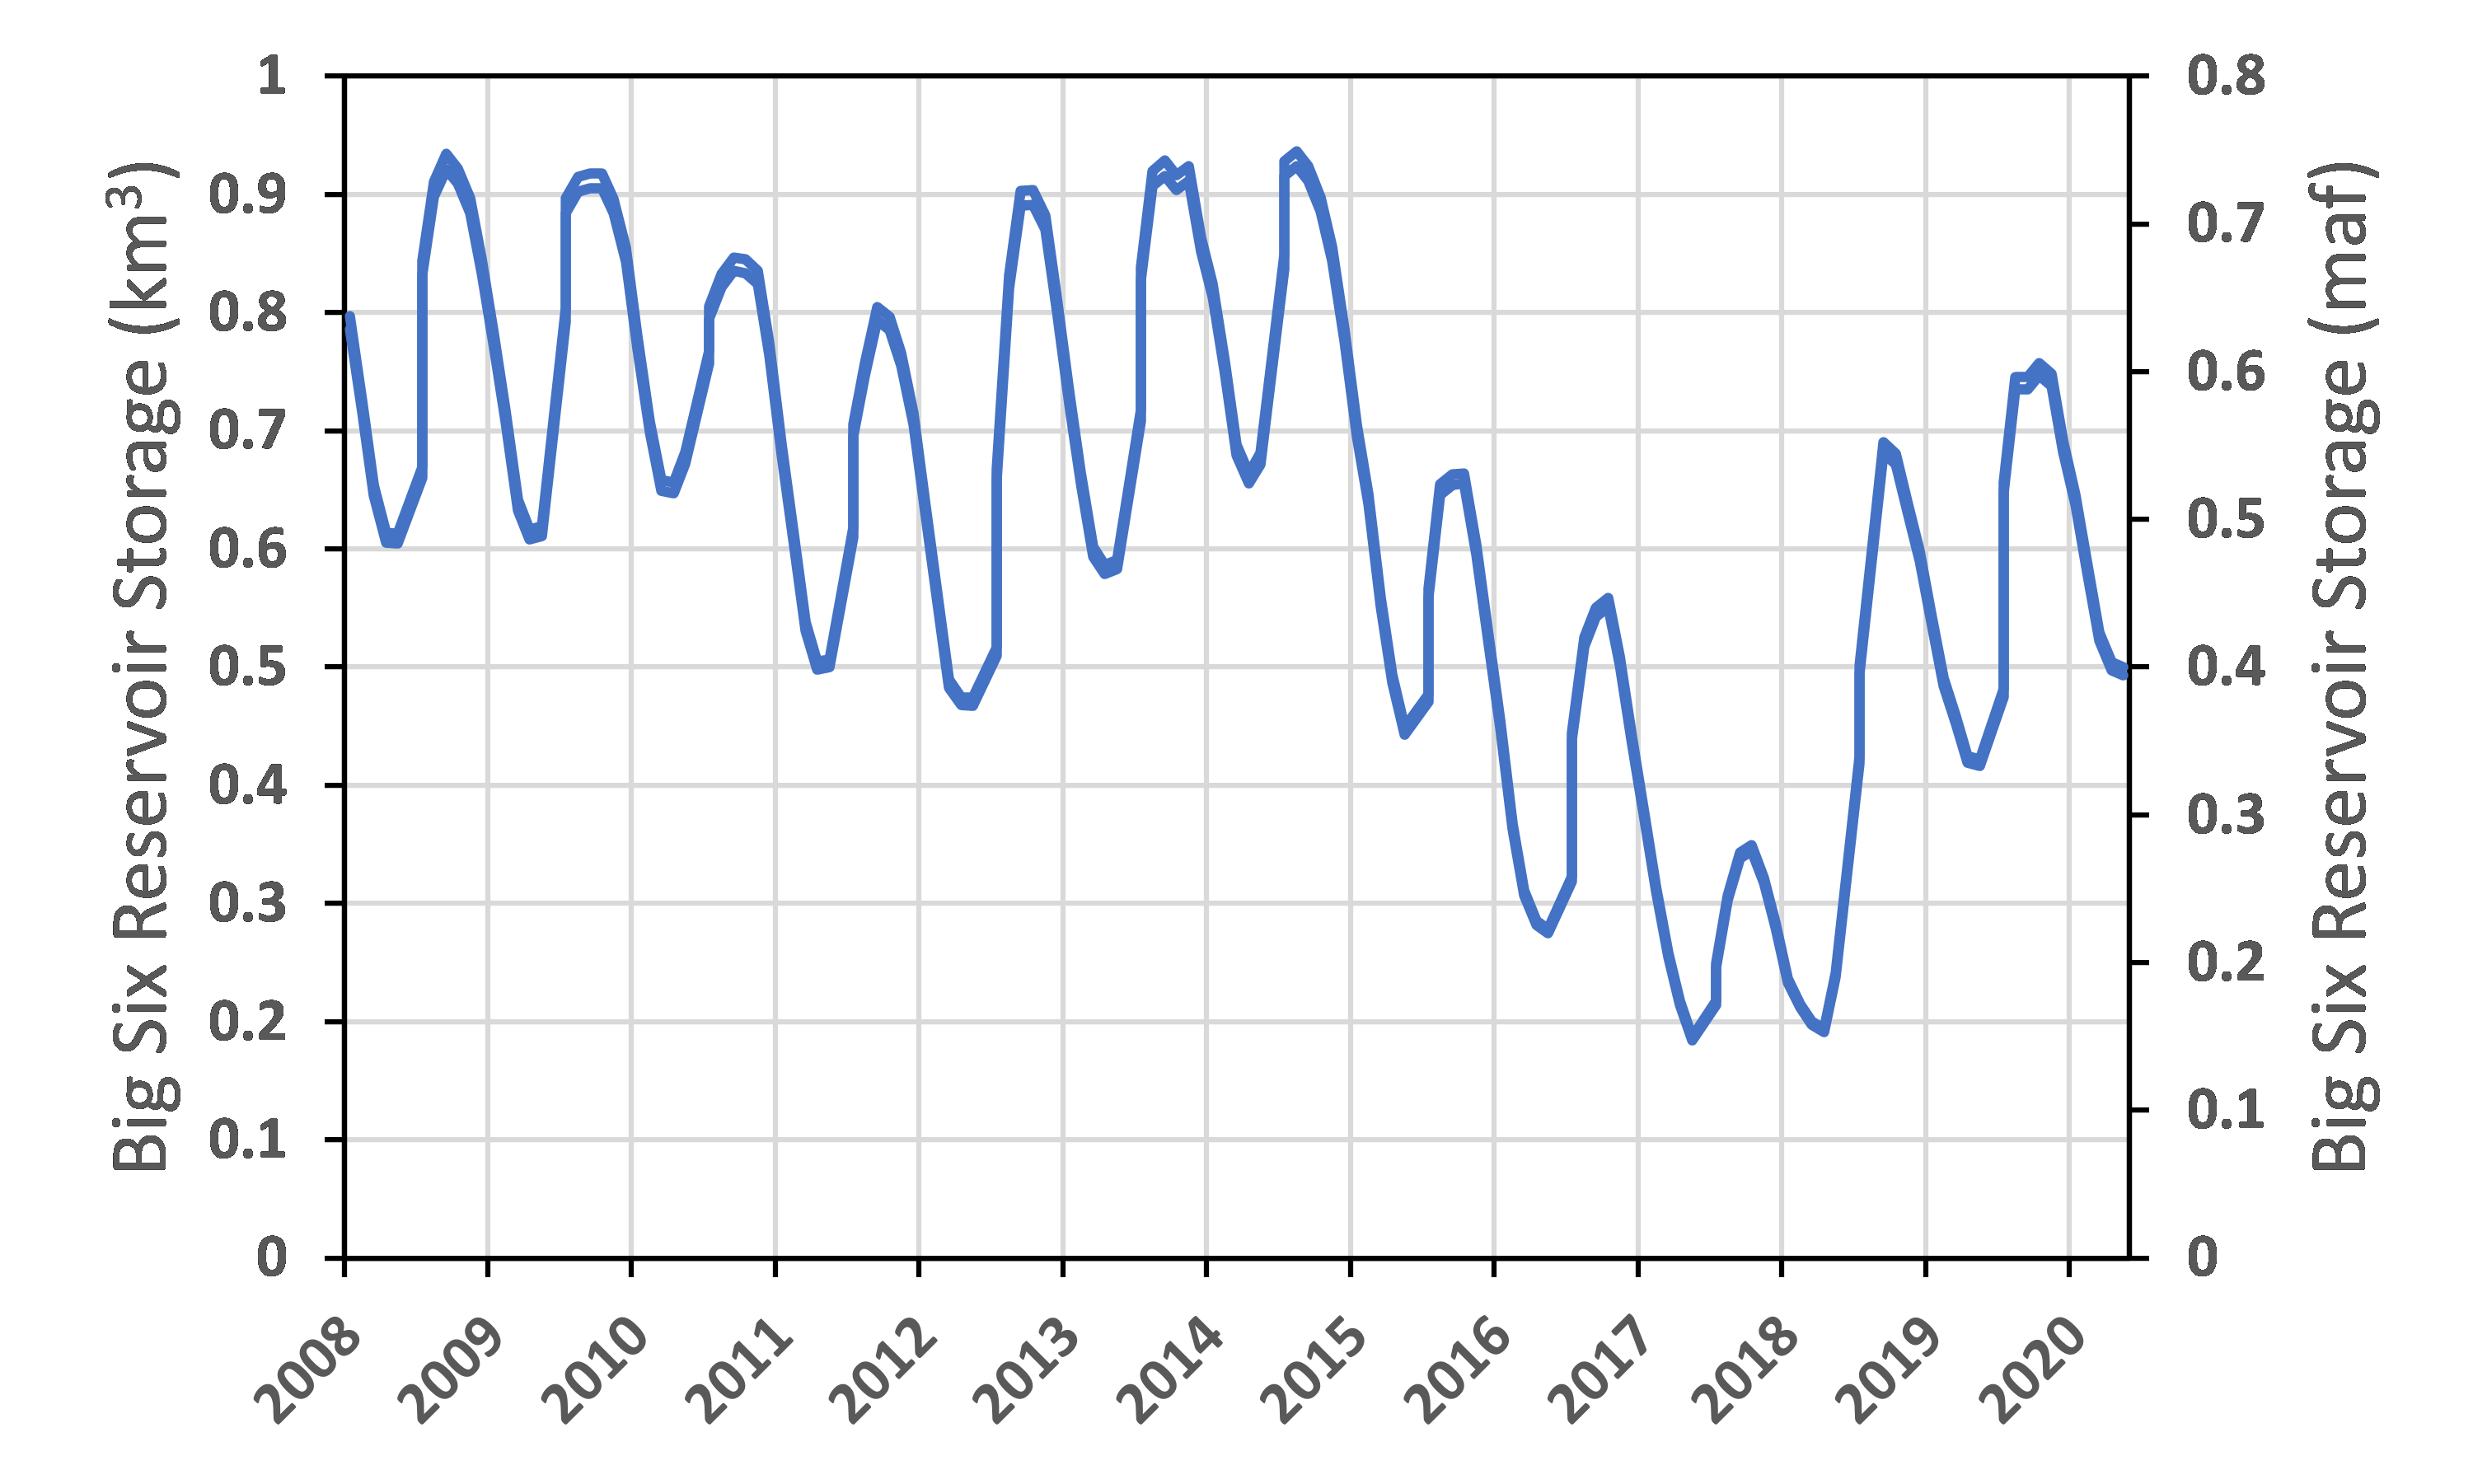
- Reservoir capacity decreased from 90% at beginning of 2014 to 50% in 2015 and ~20% in 2017, and the threshold set for Day Zero was 13.5%.
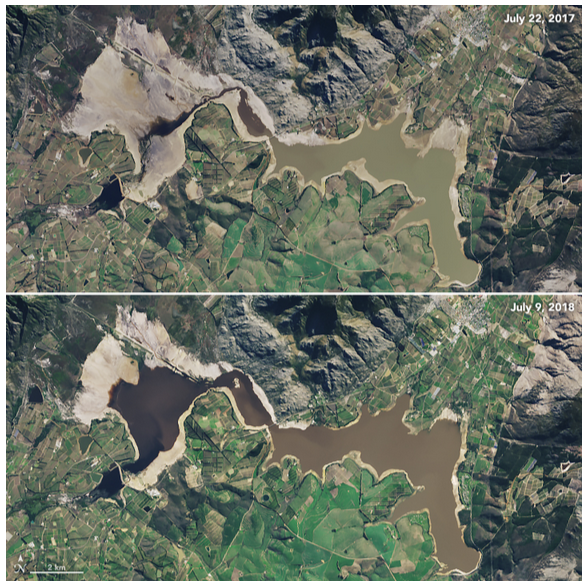
- Reservoirs recovered in 2018 (Fig. 2).
Water management approaches:
- Increase supplies, difficult over short time period. Limited temporary desalination, groundwater supplies difficult to develop in short time. Wastewater reuse is currently being considered.
- Reduce demand: demand was reduced by ~50% during the drought (Fig. 3) (Water Outlook 2018 Report). Water saving technologies, considering the cost of water and penalizing large users and putting restrictions on water use.
- Public awareness campaign around Day Zero with taps running dry.
- Can survive without electricity or power but not without water, including households, businesses etc.
Long-term benefits: expansion of groundwater development, it is ubiquitous, under our feet.
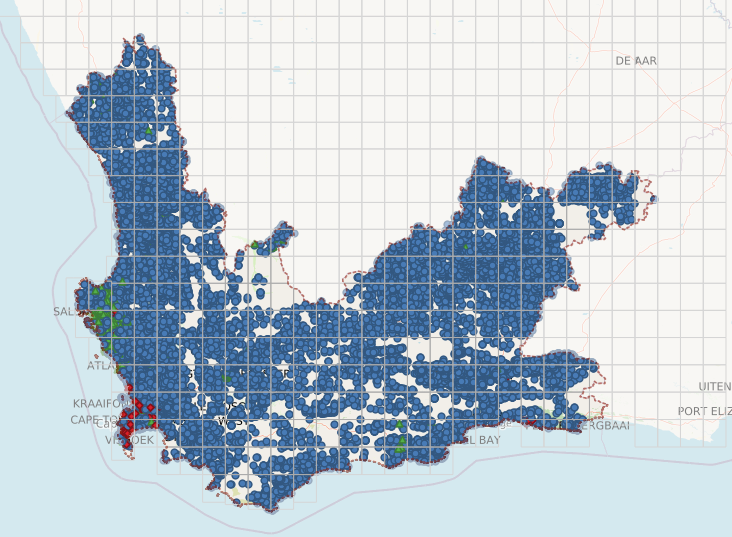
Hundreds of boreholes being drilled for residents in more affluent areas and industries (Fig. 4). Cost of borehole drilling increasing 400%. A dashboard has been developed to track monitoring networks in the Table Mountain Water Source Area (link).
Similar to household solar panels for managing ESKOM intermittency in electricity supplies, residents were drilling boreholes to secure water supplies.
Department of Water and Sanitation: encouraging residents to develop their own water supply but this is non-revenue water which can be problematic in the long term.
Water storage for Cape Town had not kept pace with population growth: 70% increase in population from 1995 (2.5 M) to 2015 (4.1 M) but reservoir storage capacity only increased 17%.
Much of the population growth from semigration, people migrating within S Africa to Cape Town.
Water demand: summer Cape Town up to 1000 ML/day. Target to reduce demand to 500 ML/day (Fig. 3).
Weekly dashboard on reservoir levels, published big water-user list.
Rainfall in Cape Town: average annual ~ 800 mm/yr but up to 2000 mm/yr at higher elevations around Cape Town. Supply dams in mountainous catchments.
Water usage for irrigation was curtailed during the drought
Study in local area with river feeding supply dams: over 3000 jobs lost in the agricultural sector, 44% reduction in agricultural production during drought. Agricultural sector largest victim of drought. They also turned to groundwater. No compensation to farmers for water reductions.
Most agriculture near Cape Town: perennial plants (vineyards, orchards etc), cannot be fallowed readily during drought.
Cities may purchase water from the agricultural sector in the future as cities continue to grow and compensate the farmers.
GEOSS company specializes in hydrogeology, staff increased from 5 – 10 people to 25 technical staff, including hydrogeologists, engineers, geophysicists during the drought.
GEOSS focuses on (1) groundwater exploration, (2) geophysical surveys, (3) borehole drilling management, (4) yield and quality testing, (5) groundwater monitoring, (6) numerical modeling, (7) contamination, and (8) legislative requirements.
They focus primarily in Africa but are also doing some work in the Middle East.
Major aquifers near Cape Town: Table Mountain Group and Cape Flats aquifers.
Lower unit: Peninsula Formation, quartzitic sandstone, steep resistant to erosion, ~500 – 1000 m deep near Steenbras Dam.
Upper unit: fractured rock aquifer, folded and faulted, 0 – 500 m near Steenbras Dam.
Cape Town: evaluating TMG aquifer since 2000.
Concern about groundwater abstraction on groundwater dependent ecosystems, wetlands.
Drilling in upper and lower units, wells 200 – 400 m deep.
When target the confined aquifer, it is artesian and water rises to the surface, so not energy intensive to abstract the groundwater. Pumping from confined aquifer will not impact GDEs because the confining layer (thick clay) separates the ecosystems from the aquifer.
Monitoring soil moisture, linking to groundwater levels. Building a SWAT (Soil and Water Assessment Tool) model.
Target groundwater development areas selected based on proximity to supply dams to take advantage of the water supply infrastructure.
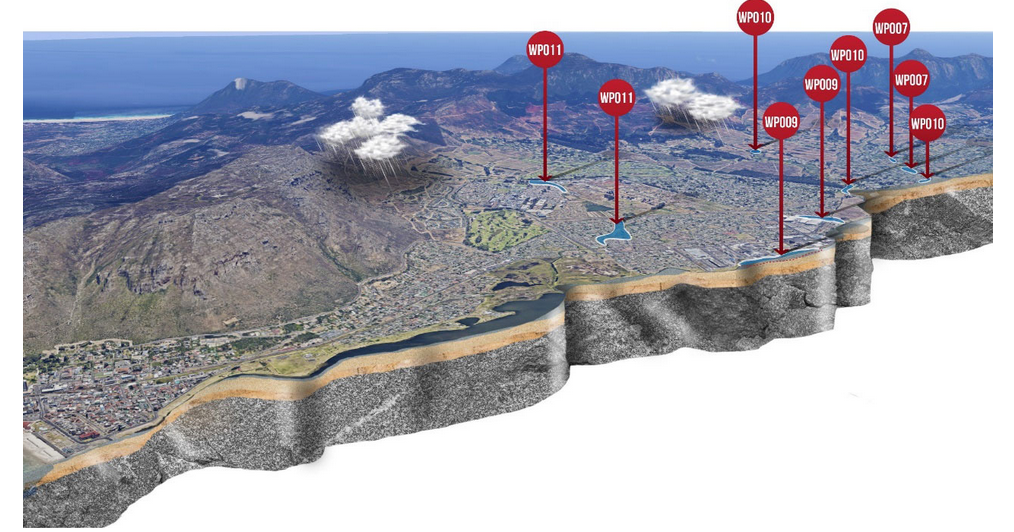
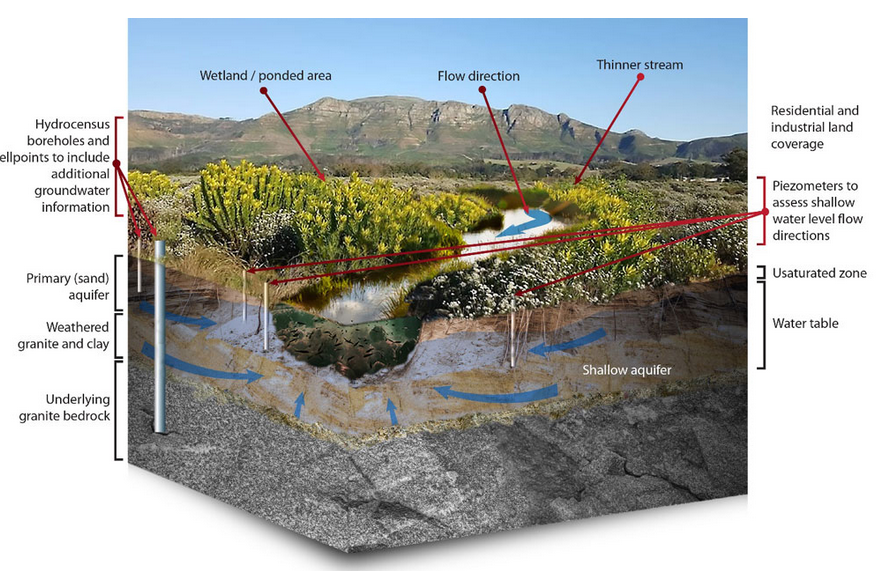
Livable Urban Waterways Project in the Sand River (GEOSS project) (Figs. 5 and 6).
Cape Flats aquifer, primary aquifer with paleochannels up to 50 m thick with high yields.
Water quality issues in the groundwater and rivers.
Livable waterway, similar to sponge city, able to absorb and manage surface water effectively.
- Water quality: free from sewage, litter and invasive species with indicators such as E.Coli, nitrogen, and phosphorus, litter, and sediment levels
- Flood management: accommodate flooding without risking surrounding communities
- Ecological functioning: diverse habitat structure, healthy biodiversity of aquatic life.
- Connectivity to water table and floodplain: hydraulically connected to aquifers, floodplains, and wetlands. Indicator: % of permeable area
- Community engagement: recreational, educational, and exercise purposes.
- Ecosystem services and benefits: green infrastructure, using natural processes to treat water, reduce flooding, enhance biodiversity, trap sediments, recycle nutrients reduce heat and sequester carbon. Indicators: ecosystem services, economic benefits, or social benefits
Removing canal linings in some areas to reconnect rivers with aquifers.
Have sewage treatment in most areas. Some areas may have city sewerage infrastructure leaking, while some informal settlements do not have water borne sewerage systems.
Stormwater holding bay, poor quality stormwater amplified during dry season with limited dilution.
Creating riprap over wetlands, slowing water down, allowing infiltration and natural attenuation from wetlands and river sites.
Cape Town is effectively importing water because the big six supply dams are in catchments outside of the city. Return flow from the imported water raises groundwater levels in the Cape Flat aquifer, increasing flood risk in some regions and contamination.
Cape Flats provides < 5% of total supply for Cape Town.
Treating waste water and injecting it using managed aquifer recharge to reduce saline water intrusion from the coast into the Cape Flats aquifer.
The Philippi Horticultural Area also poses a contamination risk to the Cape Flats aquifer.
Table Mountain Water Source Partnership: one of strategic water source areas. 50% of water comes from <10% of land area: Need to protect these areas.
Table Mountain acts like a water tower with increased precipitation.
Concern about unregulated groundwater use, citizen science, reporting, hydro census. 800 boreholes/km2, ~ 1 bh ev 50 m.
GEOSS supplied water table pressure transducers to monitor groundwater levels in six communities.
Built dashboards to communicate monitoring results.
Small municipalities surrounding Cape Town, relying entirely on groundwater. Water shedding, related to drought. Vandalism and theft are also problems.
Lamberts Bay: hydrocensus, geophysical surveys for exploration and production.
Department of Local Government investing in water security for these communities.
Cape Town was projected to be subjected to drought in 2024 related to EL Nino but had atmospheric river landfall in July 2024 which significantly increased the volume of rain received.
Groundwater is often underutilized in Sub-Saharan Africa. need to expand groundwater development.
Current Government of National Unity, situation improving, have not experienced loadshedding within past year.
Namibia, Angola and Zambia if do not get summer rains could experience famine.
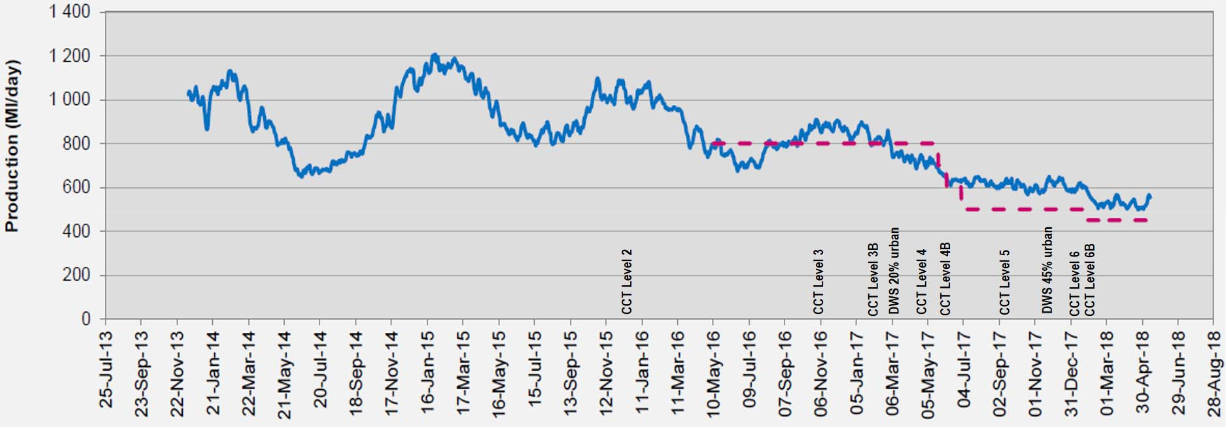
Peak summer consumption in 2015: ~1200MLD (million liters per day). In
Summer 2015/16 under level 2 restrictions: ~1100MLD.
Summer 2016/17 under level 3 restrictions: ~900MLD
June - December 2017 demand stabilised at ~600MLD.
Since January 2018, demand reduced to ~500MLD.
Link: Water Outlook 2018
