Listen here on Spotify | Listen here on Apple Podcast
Episode released on March 06, 2025
Episode recorded on September 27, 2024
 Edson Wendland is a Professor in the Engineering School of São Carlos within the University of São Paulo in Brazil.
Highlights | Transcript
Basic Facts about Brazil:
Population: 216 million (2023)
Area: 8.5 million km2 (a little bigger than CONUS, 8.1 million km2), 26 states and the Federal District
Official language Portuguese
Capital Brasilia, largest city Sao Paulo (12 M people, 18 M people over larger area)
Portuguese colony until 1822, local monarch until 1889, then Federal Republic
Climate: temperate in S Brazil evolving through subtropical – tropical and Equatorial conditions at Equator
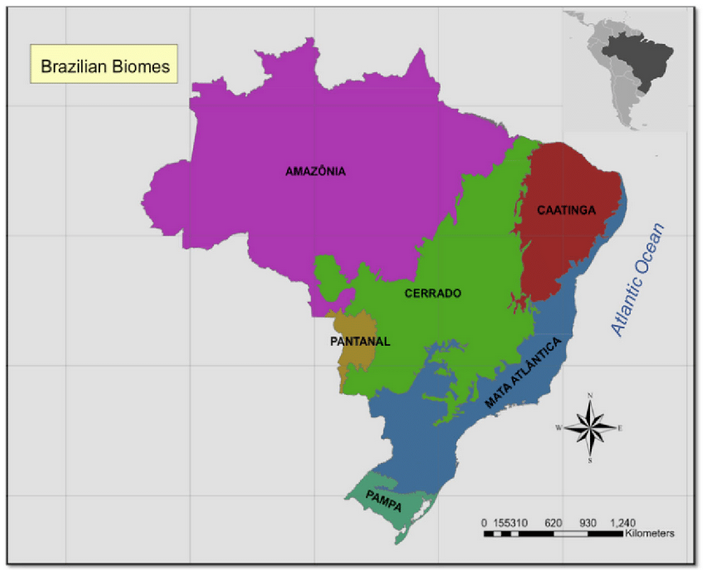
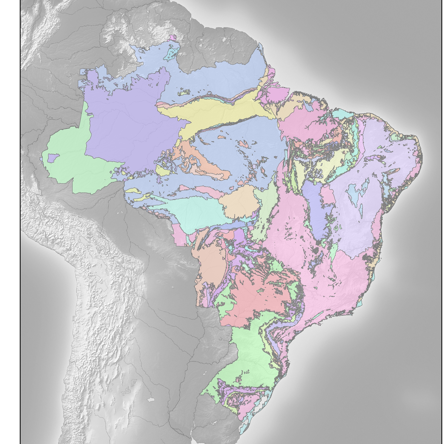
Biomes: grassland in S, forest in S and along coast, central region Cerrado (shrub land with trees, 22% of Brazilian area), Amazon (4 M km2) (Fig. 1).
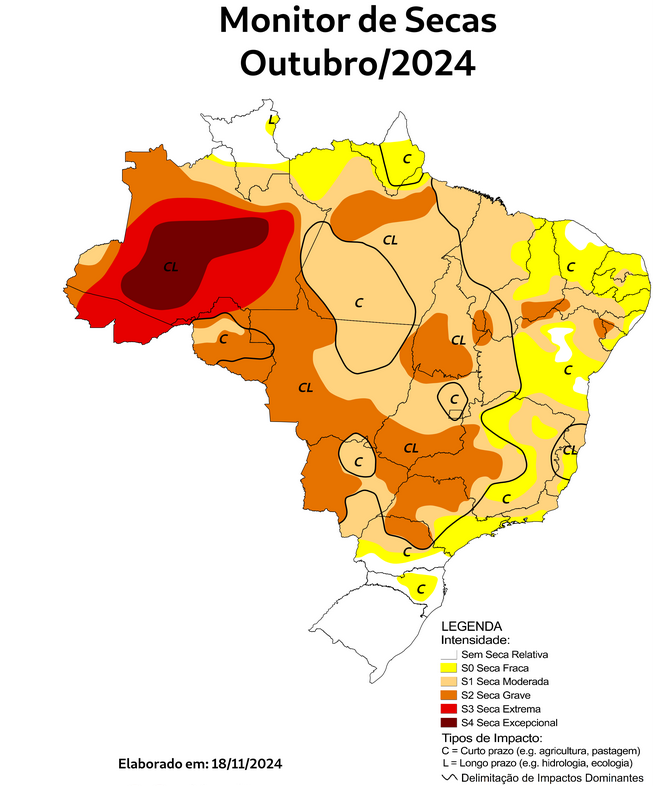
Brazil currently in drought: started in 2023, attributed to warmer oceans, El Nino in Pacific and in N Atlantic. Amazon region, strongest drought (link) (Fig. 2), lowest river discharges near Manaus and Porto Velho, fish kills in some rivers.
Flying rivers (atmospheric rivers) transport moisture from Amazon region to SE, even to Argentina Fassoni-Andrade, 2021, World Economic Forum, July, 2024.
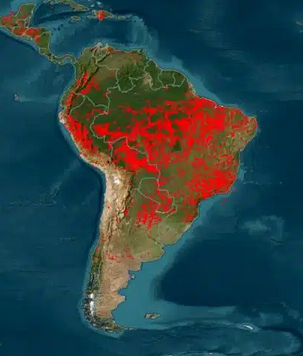
Many thousands of fire spots in the Amazon region this year covering 5 million km2, similar to ~ half of continental US (CONUS) (Fig. 3). Flying rivers transporting smoke resulting in poor air quality.
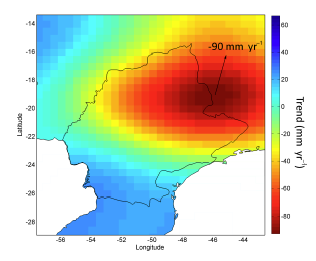
Intense drought 2014 – 2015 in SE Brazil, block flying rivers from the Amazon due to high pressure over central Brazil. Moisture from Amazon could not reach Sao Paulo. Reduced rainfall during wet period from Oct – Mar, Sao Paulo rainfall ~1,500 mm/yr (Fig. 4) (Melo et al., HESS, 2016).
Sao Paulo relies on system of reservoirs: the Cantareira system 5 – 6 reservoirs, ~ 30 m3/s watershed transfer with reservoir storage declining to <10% in some reservoirs during drought.
Reservoirs at lowest level 2014 – 2016. (Nobre et al., 2016)
Now expanded the water sources to increase drought resilience. Connected to Sao Lourenço system to the south of São Paulo, and Paraiba do Sul watershed, which also feeds Rio de Janeiro (8 – 10 million people).
Water budget Sao Paulo:
High rainfall 1,200 – 1,300 mm/yr, high sun energy resulting in high ET (1,100 – 1,200 mm/yr)
Many (~ 2,000) private groundwater wells in Sao Paulo. Groundwater not managed.
Small sedimentary basin (aquifer) provides ~ 10 m3/s during the 2015 drought.
Sao Paulo is adjacent to the coast: could potentially desalinate seawater, but Sao Paulo is 1 km above the sea, would require lot of energy to transport desalinated seawater to Sao Paulo.
Guarani Aquifer System (GAS) outcrop area ~ 200 km from Sao Paulo, could transport water using pipeline (Fig. 5). Water is also linked to energy through hydroelectric power plants, which supplies ~ 2/3rds of electricity in Brazil.
Large reliance on hydroelectricity results in electricity being vulnerable to drought, as seen in the current drought.
Up to the 1970s, hydroelectricity produced from dams, largest Itaipu in Parana Basin between Brazil and Paraguay, ~66 000 GWh (2023), ~10% of Brazil’s total electricity production.
Brazil consumes ~708 000 GWh of electricity 2023 (link).
Since 2000, building hydroelectric power plants in N Brazil, mostly relying on run of the river rather than storage dams, reducing negative environmental impacts of flooding using dams but increasing drought vulnerability of electricity generation.
During current extreme drought in N Brazil, many power plants reduced production.
For example: Madeira river (tributary of Amazon) draining part of Bolivia and Peru and flowing into Brazil at Porto Velho. Santo Antonio dam. Normal electricity production 4 GWh. Current drought, reservoir level lowest in 70 yr. 90% reduction in electricity generation. Replaced with fossil fuel, natural gas power generation.
Electric grid connected in all states except Roraima, adjacent to Venezuela. Electricity transported from Amazonas to central and S Brazil, ~3000 km.
2023: electricity generation by energy source: 5% natural gas, 8% biofuels, 13% wind, 7% solar.
Biofuels mainly sourced from sugarcane.
Groundwater: Guarani Aquifer System (GAS) (Fig. 6), Global Environmental Fund (GEF) large study.
Aeolian sandstone aquifer with high porosity and permeability, covered by basalt during Cretaceous.
GAS: 10% unconfined outcrop zone, 90% confined. (Araujo et al., 1999)
Area 1.2 M km2 Argentina, Uruguay, Paraguay, and 8 states in Brazil, ~ 3× the area of the High Plains aquifer in the US.
Aquifer thickness: 50 m in outcrop zone to 800 m in central basin.
Max. depth 1.8 km in Argentina.
Age of GW in GAS: up to 500,000 yr, fossil water in some areas (Kr dating).
Outcrop zones: young GW.
Volume of GW: 25,000 – 35,000 km3.
Outcrop zone near San Carlos, age of water ~10,000 yr old.
Ribeirão Preto city: ~ 700,000 people. They rely on the Guarani Aquifer System, near the outcrop.
Bauru Aquifer: overlies GAS, separated by basalt. Area: ~370,000 km2, ~ 200 m thick.
Many cities in Sao Paulo state rely on the Bauru Aquifer.
São José do Rio Preto city: ~ 500,000 people, ~2,500 wells
Urucuia Aquifer System: NE Brazil, in the Cerrado area. (Eger et al., 2021)
Area: 76,000 km2. Sandstone aquifer. 250 – 350 m thick. ~ 4,000 km3 of water.
Irrigation with this aquifer expanded in past 20 – 30 yr.
Rainfall in this region, 800 – 1500 mm/yr.
Agricultural expansion with improve seeds for soy, corn and cotton in this region.
Great Amazon Aquifer System (GAAS) (FAPESP, 2014): (Portuguese: SAGA. Sistema Aquifero Grande Amazonas), underground ocean, 1.3 million km2 area, 600 m thick, 20% porosity, 160,000 km3 of water. Developed from erosion of the Andes and sediment transport by the Solimões River.
Geologic formations: Solimões Formation, the Amazon Formation, Alter do Chão Formation.
Contains more water than the Nubian Aquifer.
Research on groundwater in Guarani Aquifer System near San Carlos:
Evaluated relationship between recharge and land use: eucalyptus, sugarcane, citrus, orange, mainly pasture, natural vegetation, cerrado.
Monitored groundwater levels, used water table fluctuation (WTF) method to estimate recharge.
Precipitation: 1500 mm/yr
Recharge rates (mm/yr) under different land use based on WTF (2004 – 2011) (Lucas and Wendland, HSJ, 2020).
| Recharge | % of Precip. | |
| Eucalyptus | 135 | 8 |
| Citrus | 248 | 16 |
| Sugarcane | 296 | 19 |
| Grassland | 401 | 26 |
Surface water/groundwater interaction: monitored using distributed temperature sensor (DTS)
Surface water recharging groundwater in about half of the stations examined in Brazil (Uchoa et al., Nature Comm., 2024).
Looking at chemistry and biology in the hyporheic zone
Brazil fed ~ 10% of the global population of 7.8 billion in 2020, including ~ 0.5 billion people outside of Brazil (Araujo, Reuters, 2021).
Brazil has potential to increase food production and feed an additional billion people.
Research on seeds by Embrapa, genetically modified seeds, can harvest up to 3 times/yr, plenty of energy and land.
Merrick, T., S. Pau, M. L. S. P. Jorge, T. S. F. Silva, and R. Bennartz (2019), Spatiotemporal Patterns and Phenology of Tropical Vegetation Solar-Induced Chlorophyll Fluorescence across Brazilian Biomes Using Satellite Observations, Remote Sensing, 11(15), 1746.

