Listen here on Spotify | Listen here on Apple Podcast
Episode released on February 6, 2025
Episode recorded on September 5, 2024
 Kyle Davis is a Professor at the Dept. of Geography and Spatial Sciences at the University of Delaware where he runs the Sustainability Lab.
Highlights | Transcript
Global population is projected to grow to 10 billion by 2050 along with increasing incomes driving dietary changes and resulting in increased demand for food.
One approach to address rising demand would be agricultural intensification through irrigation.
Irrigation: 70% global water withdrawal and 90% of water consumption (Siebert et al., 2010).
Global maps of irrigated area were dated, most maps based on data from 2000.
Kyle and colleagues developed time-series of global gridded maps of the area equipped for irrigation (AEI) from 2000 up to 2015 (Mehta et al., 2023).
AEI expanded by ~ 10% from 2000 – 2015
Irrigation maps provide important input for global crop modeling, climate research, and water science.
Irrigation expansion? Is it sustainable in terms of water resources?
Results show that about half of irrigation expansion over 2000 – 2015 occurred in areas where there is blue (surface water, groundwater) water scarcity (mostly China, India, Pakistan) and other half in areas where there is sufficient water to support irrigation (mostly in Brazil, Indonesia, Italy and France).
One of the key drivers for their work was to develop global irrigated maps that consider FAIR (Findable, Accessible, Interoperable, and Reusable) guidelines (Peng et al., 2022) and make the codes open access.
Irrigation data were collated from agricultural ministry reports, combining AQUASTAT which is very time consuming.
Also updated Mirca Irrigated and Rainfed Cropped Areas (MIRCA) up to 2015.
Their study focused on water sustainability but not on other aspects of sustainability used by farmers, governments, and investors are using to make irrigation decisions. Water sustainability is not necessarily the primary consideration in a lot of contexts when you're thinking about irrigation.
These irrigation maps do not distinguish between areas equipped for irrigation and areas actively irrigated within year.
Remote sensing is very important for assessing interannual variability in areas that are actively irrigated.
Crop type: annual vs perennial is an important factor because it determines whether you can fallow during a drought. California has hardened irrigation water demand by switching from annual crops that can be fallowed to perennial nut trees in many areas (Faunt et al., 2024).
Irrigation water source: distinguishing irrigation based on water source (surface water or groundwater) is next step in their research. Irrigating with surface water can recharge groundwater.
Mapping identified areas with potential for irrigation expansion in terms of water sustainability. For example, global maps show Brazil has plenty of water to support irrigation expansion but would negatively impact native vegetation, like Cerrado in central Brazil.
Eastern US also has potential for irrigation expansion in this humid region.
Davis and his team area applying machine learning (ML) to develop a rapid approach to develop global irrigation maps. ML a complementary tool to existing mapping approaches.
Traditional irrigation mapping approaches based on agricultural censuses (generated every 5 – 10 yr).
ML approach based on Landsat, 30 m pixel resolution, uses Global Cropland Extent (GLAD) from Univ. Maryland.
Data used to estimate irrigation: cropland type, NDVI, precipitation, dry spells, soil moisture, etc.
Goal: develop annually updated maps of global irrigation extent.
Other questions addressed: multi-cropping?
In future, they plan to use different cropland products to assess irrigation.
Optimal approach: combining ML and process-based modeling.
Interannual variability in irrigation related to climate variability, economic decisions, markets, food process etc.
Sustainable food systems: three aims of moving beyond the Green Revolution in an Editorial to a Focus issue (Davis et al., ERL, 2022).
- Expanding the definition of sustainability: examples, 33% GHG from food systems, climate impacts on food systems, environmental pressures from food production, unsustainable irrigation etc.
- Identifying and quantifying synergies and tradeoffs: e.g., ↑ insect consumption, ↑ seafood consumption, dietary shifts, knowledge co-development with stakeholders.
- Linking solutions with action: multidimensional solutions with policy and decision making. Provide data to decision makers and policy makers to address multiple considerations. Examples include land, water, greenhouse gases (GHGs).
Solution testing and cascading impacts.
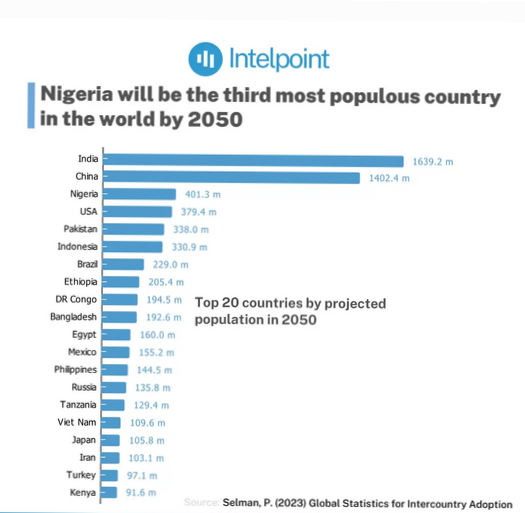
Kyle Davis work in Nigeria: potential for enhancing food security and moving towards self-sufficiency.
Nigeria: 2020 population 205 million; 2050: 401 million; ranked third after India (1st) and China (2nd) (link)
Evolution over past 15 years: urbanization, land use conversion, rising mid-sized and commercial sized farms, infusing technology into farming
Farming dominated by smallholders. Little irrigation.
Increase crop production using commercial farms? What is the future for smallholder farmers. Smallholders often don’t have formal legal claim to land.
Federal Government of Nigeria: Memorandum of Agreement with World Bank for $500 million for Sustainable Power and Irrigation for Nigeria (SPIN) across 25 states (World Bank link).
Irrigation infrastructure: installation of additional dams and rehabilitation of irrigation dams across the country.
These projects should consider the fate of smallholder farmers, can they afford diesel to pump the water from the dams, will commercial irrigation displace smallholders?
Global Food Trade: Brazil could feed an additional 1 billion people but what are the tradeoffs? Intensify agriculture, more fertilizers, more GHGs, more water use, more ecological impacts and food for whom?
Food trade: ¾ of nations globally are net importers (FAO Food Trade). Food trade is required to meet international dietary demands.
Food trade may also benefit climate resilience.&
Countries heavily reliant on food imports are vulnerable to global disruptions in food trade.
Food supply chain resilience to environmental shocks (Davis et al., Nature Food, 2021)
Food trade networks: richer countries first in line during crises.
Optimize crop production to improve sustainability in terms of ghgs, blue water demand, pesticide use, fertilizer use, and enhance farmer’s incomes (Davis et al., GEC, 2016).
Assume overall crop extent cannot change and levels of crop production cannot change at national level.
Analysis in US: shift crops in six major basins from alfalfa to barley etc (Richter et al., Nature Water, 2023).
Implications for calorie production of crop shifting.
Crop shifting to enhance sustainability in Sahel region: blue and green water demand, instream flows, could reduce water demand below renewable supplies (Davis et al., Nature Geosci., 2017).
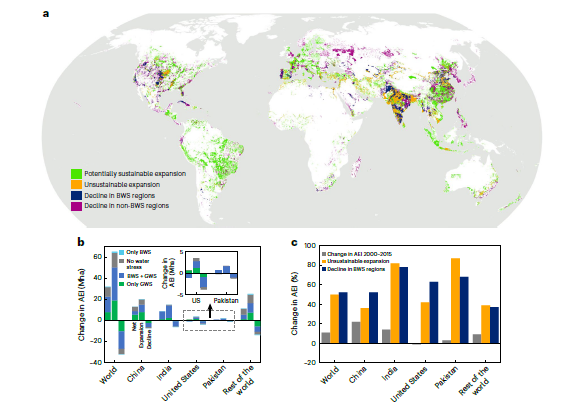
a. Map showing four categories of AEI change: potentially sustainable expansion (that is, in areas of green water stress (GWS) or no water stress), unsustainable expansion (that is, in areas of Blue Water Stress (BWS) or BWS + GWS), decline in BWS regions and decline in non-BWS regions. Blue water resources are relatively abundant in areas with only GWS or with no water stress (that is, there is no BWS).
b. Changes in net AEI as well as AEI expansion and decline from 2000 to 2015 by water stress category for major countries.
c. Percentage change in net AEI from 2000 to 2015, percentage of unsustainable AEI expansion (that is, in areas of BWS) and percentage of AEI decline in BWS regions. Basemap in a from GADM52.
Mehta et al., Nature Water, 2024
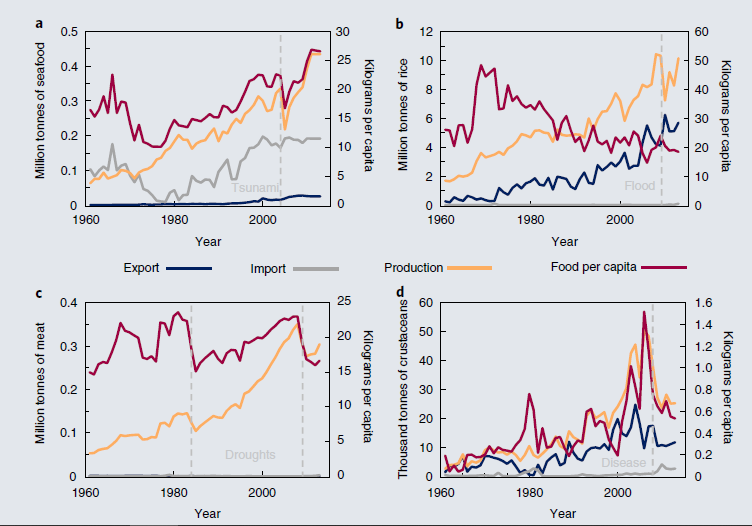
a. The December 2004 tsunami in Sri Lanka was associated with a marked decline in seafood
production. As much of the country’s seafood catch is consumed domestically, this resulted in more than a 20% decrease in per capita seafood supply relative to the previous year.
b. Floods in Pakistan in 2010 impacted agriculture with 2.4 million hectares of standing crops, 1 million tonnes of food and seed stocks, and 11 million livestock and poultry either lost or damaged. Rice imports increased tenfold compared to those in the previous year.
c. Droughts in Niger have periodically contributed to substantial declines in livestock production. As nearly all of the meat in Nigerien diets comes from domestic production, these shortfalls have contributed to marked reductions in per capita supply.
d. In Venezuela, Taura syndrome virus produced strong impacts on shrimp production, with knock-on effects for the country’s exports and domestic availability.
Davis et al., Nature Food, 2021