Listen here on Spotify | Listen here on Apple Podcast
Episode released on July 10, 2025
Episode recorded on April 24, 2025
Image

Todd Votteler discusses the evolution of water markets in Texas, focusing on the Rio Grande and San Antonio basins.
Todd Votteler is the principal at the Collaborative Water Resolution that addresses conflict resolution, stakeholder engagement, and policy development. He is also co-founder and editor-in-chief of the Texas Water Journal and hosts the podcast Talk+Water.
Highlights | Transcript
Water Markets in Texas (Votteler et al., 2025)
- Water challenges in Texas: increasing population, ~ 30 million in 2020 to ~ 51 million by 2070 (TWDB link).
- Report titled Water Markets for Texas (Mar. 22, 2205) (Fig. 1) by Todd Votteler with contributions from Gabe Collins (Edwards Aquifer market, Baker Institute for Public Policy, Rice Univ.) and from Matthew Berg (Rio Grande water markets, Simfero Consultations LLC). Study funded by Lyda Hill Philanthropies.
- Water markets in Texas:
- Edwards Aquifer water market.
- Rio Grande water market.
- Water use in Texas in 2020 total 14.7 million acre feet (18.1 km3) (TWDB link):
- irrigation, 8.1 maf, 55%;
- municipal: 4.5 maf, 31%,
- Manufacturing, 7%; Power, 3%; Mining, 2%; Livestock 2%
- Water sources in 2020: 55% groundwater, 42% surface water, and 3% reuse.
- Economic benefits of an acre foot of water in 1995 (TWDB, 2002 State Water Plan, p. 120):
- Region L, including San Antonio and Edwards Aquifer: Commercial ($335,305), residential ($39,512), irrigation $121).
- Irrigation largest water user but lowest return on investment.
- Definition of a water market (Votteler et al., 2025): “An organized and regulated system that facilitates temporary and/or permanent exchanges of water usage rights from any source, among voluntary participants, within a specific geographic area.”
- If you do not have a water market: then to transfer water or buy a water right or change its use, you need to:
- Obtain a permit.
- Public comment process.
- Hearings.
- Water rights holders can lease or sell their water right.
- If water value was reflected in the price of water: we would reduce water use for irrigating lawns and growing lower value crops that require substantial amounts of irrigation.
- Development of water markets often spurred by a crisis:
- 1950s drought in the case of the lower and middle Rio Grande.
- Federal cap on water allocations in the Edwards Aquifer related to endangered species.
- Types of Water Rights
- Prior Appropriation doctrine (mostly in W US) (Fig. 1), First in time, first in right.
- Priority based on date of first beneficial use.
- Riparian Water Rights: most common in E US, linked to land ownership near surface water bodies, allowing water diversions to landowners for beneficial use.
Rio Grande Water Markets
- Rio Grande: Prior Appropriation Rights, but the system was not working:
- Judge Starley replaced Prior Appropriation with Correlative Rights system based on water stored in Amistad Reservoir (Fig. 2).
- Municipal and industrial uses prioritized over others, accounting for first 225,000 af in Lake Amistad.
- Irrigation water use decreased from 93% of water use in 1971 to ~85% today.
- If agricultural water rights are converted to municipal water rights, they are reduced by 50% or 40%.
- No new water projects in the Lower and Middle Rio Grande since Amistad Reservoir.
- Most of water trades, leases or sales are among agricultural water users in the Rio Grande.
- Rio Grande challenges recently because of 1944 Water Treaty between US and Mexico (US and Mexico Convention, 1944):
- Water sources limited: no new suitable locations for reservoirs.
- Groundwater resources limited.
- Data from Rio Grande and Edwards Aquifer suggest that the impact of water markets on agricultural water use varies depending on the design and scope of the water market.
- The Lower Rio Grande water market did not reduce irrigation consumption substantially (93% in 1971 to 85% in 2018) (Table 1).
- Irrigators develop a new business through water markets by trading or leasing or selling some of their water to other irrigators or municipalities.
- With water markets, water often goes to higher value crops, as in the case of California droughts where farmers with perennial crops (e.g., nut trees) buy water to maintain the trees during drought times.
- Pecan orchards in the Rio Grande and other parts of Texas use a lot of water to flood the land.
- Possible water market transactions: sales, leases, pay farmers to fallow land during drought.
- Water prices vary substantially:
- 2024: a municipality paid $80,000 for an acre-foot of water in Colorado.
- Often less expensive to purchase water than construct a new water project.
- Reliability of water demand projections:
- 1984: City of Brownsville, population projected to be 190,000 in 2020, actual population, 140,000.
- They also projected large water shortages: 130,000 af in 2000, and 440,000 in 2030.
- Projections of water demand often do not consider the impacts of the water market on water demand with population growth.
- Water markets usually result in reduction in water use and per capita water use.
- Edwards Aquifer water use capped and reduced further during droughts.
- Water demand had become decoupled from population growth in the Edwards Aquifer, facilitated by the water market.
- If we could create water markets in other regions of Texas that include major cities, water use could decrease or remain flat for some decades.
Edwards Aquifer Water Markets
- Edwards Aquifer: needed to limit water use in the aquifer to maintain flow in Comal and San Marcos Springs because of endangered species and establish enforceable water rights. The Edwards Aquifer Authority was created to address these issues.
- Edwards aquifer flow balance (recharge, outflow, and water use) varies and is shown related to key events (Fig. 2).
- Edwards Aquifer Authority (EAA) created in 1993: groundwater rights based on historical water use or 2 af/ac for irrigators.
- Edwards Aquifer pumping peaked in 1989 (542,000 af) even as the population grew.
- Pumping decreased to ~ 400,000 af/yr since the market was created.
- New water supplies to San Antonio: including in 2020, Vista Ridge project, 50,000 af/yr.
- Initially many of the water-market transactions may involve sales from agriculture to municipal and commercial entities (Rio Grande and Edwards markets):
- San Antonio bought water rights initially to increase their supplies to meet drought of record conditions.
- Key numbers related to the Edwards Aquifer water market (1997 – 2020) are shown in Table 2.
- The total water traded varies from < 5% to ~ 27% (2015) of the water pumped in the Edwards aquifer (Fig. 4).
- The water market relies on Edwards Aquifer groundwater. Some of that water is stored in SAWS (San Antonio Water System) Aquifer Storage and Recovery (ASR) facility.
- SAWS stored excess water in a porous media aquifer, the Carrizo Wilcox Aquifer using ASR.
- Water use per capita decreased with the water market.
- Water markets provide opportunities to manage water conflict.
- EAA originally was required to reduce the water cap to ~ 400,000 af by 2013 (while San Antonio built a reservoir over ~ 20 yr). However, they did not build the proposed Applewhite Reservoir and the cap was increased to 572,000 af by the Legislature with reductions during droughts.
- An upper limit on water use is required to establish a water market. This is difficult to attain with groundwater because of political/public opposition.
- Water storage capacity in SAWS ASR project: 300,000 af.
- ASR could be deployed in conjunction with water markets.
- TWDB has the power to create regional water banks.
- Voluntary Irrigation Suspension Program Option (VISPO): 35,000 af, farmers participate in VISPO, get paid an annual fee of $54/af and the $160/af during forbearance years when they need to stop irrigating during a drought.
- The Texas Farm Bureau did not support creation of the EAA, but farmers eventually realized after the EAA was created that they benefit from regulation of the aquifer and the water market.
- In San Antonio, water markets, and conservation including plumbing fixture replacement, and landscape conversion, resulted in the reduction of water use by almost 50%:
- Water use in 1982, 225 gpcd.
- Water use in 2022, 113 gpcd.
- Vista Ridge project, moving 50,000 af/yr from Carrizo Wilcox, 140-mile pipeline to San Antonio, simulated groundwater drawdowns of 300 – 400 ft.
Water market in San Antonio reduced the need for multiple reservoirs that were recommended in prior State Water Plans after the creation of the water market.
Image
Figure 1. Water Markets for Texas (Votteler et al., 2025) Image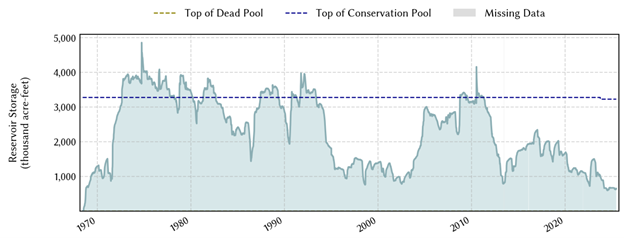
Figure 2. Time series of storage in Lake Amistad Reservoir (Water Data for Texas, TWDB). Image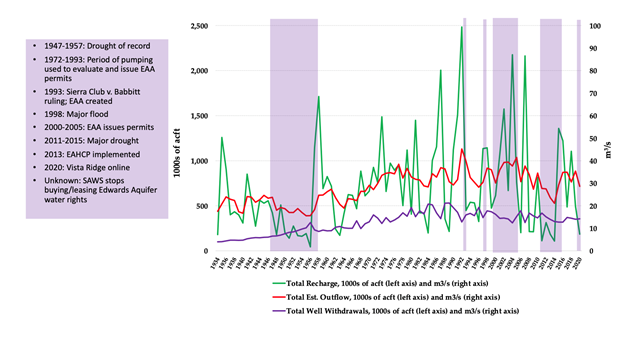
Figure 3. Edwards Aquifer flow balance relative to key events (Votteler et al., 2024). Image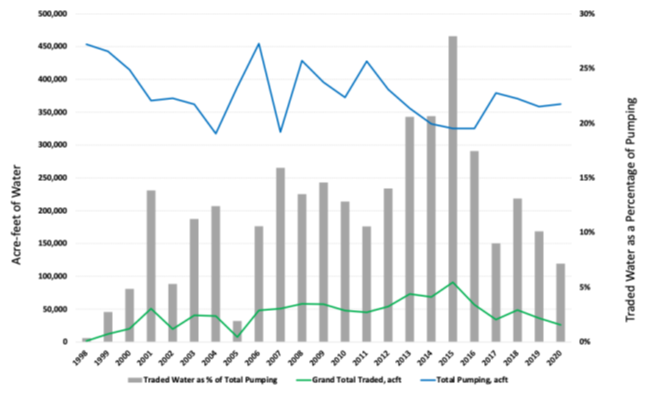
Figure 4. Total Edwards Aquifer water pumped, total water traded, and traded water as a percentage of pumping, acre-feet. Image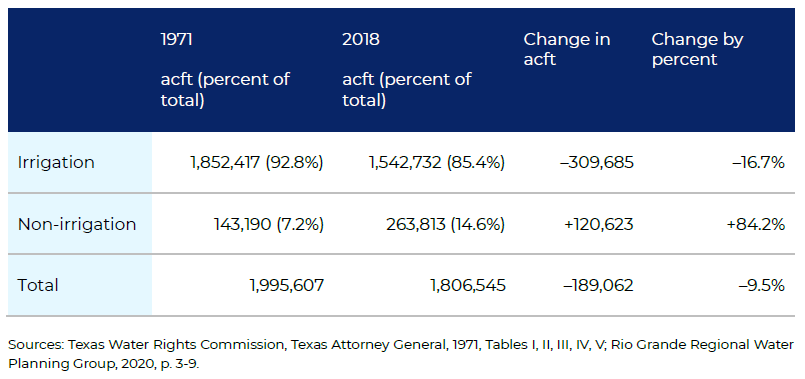
Table 1. Comparison of 1971 and 2018 Lower Rio Grande permitted consumptive surface water rights (af), Votteler et al., 2025. Image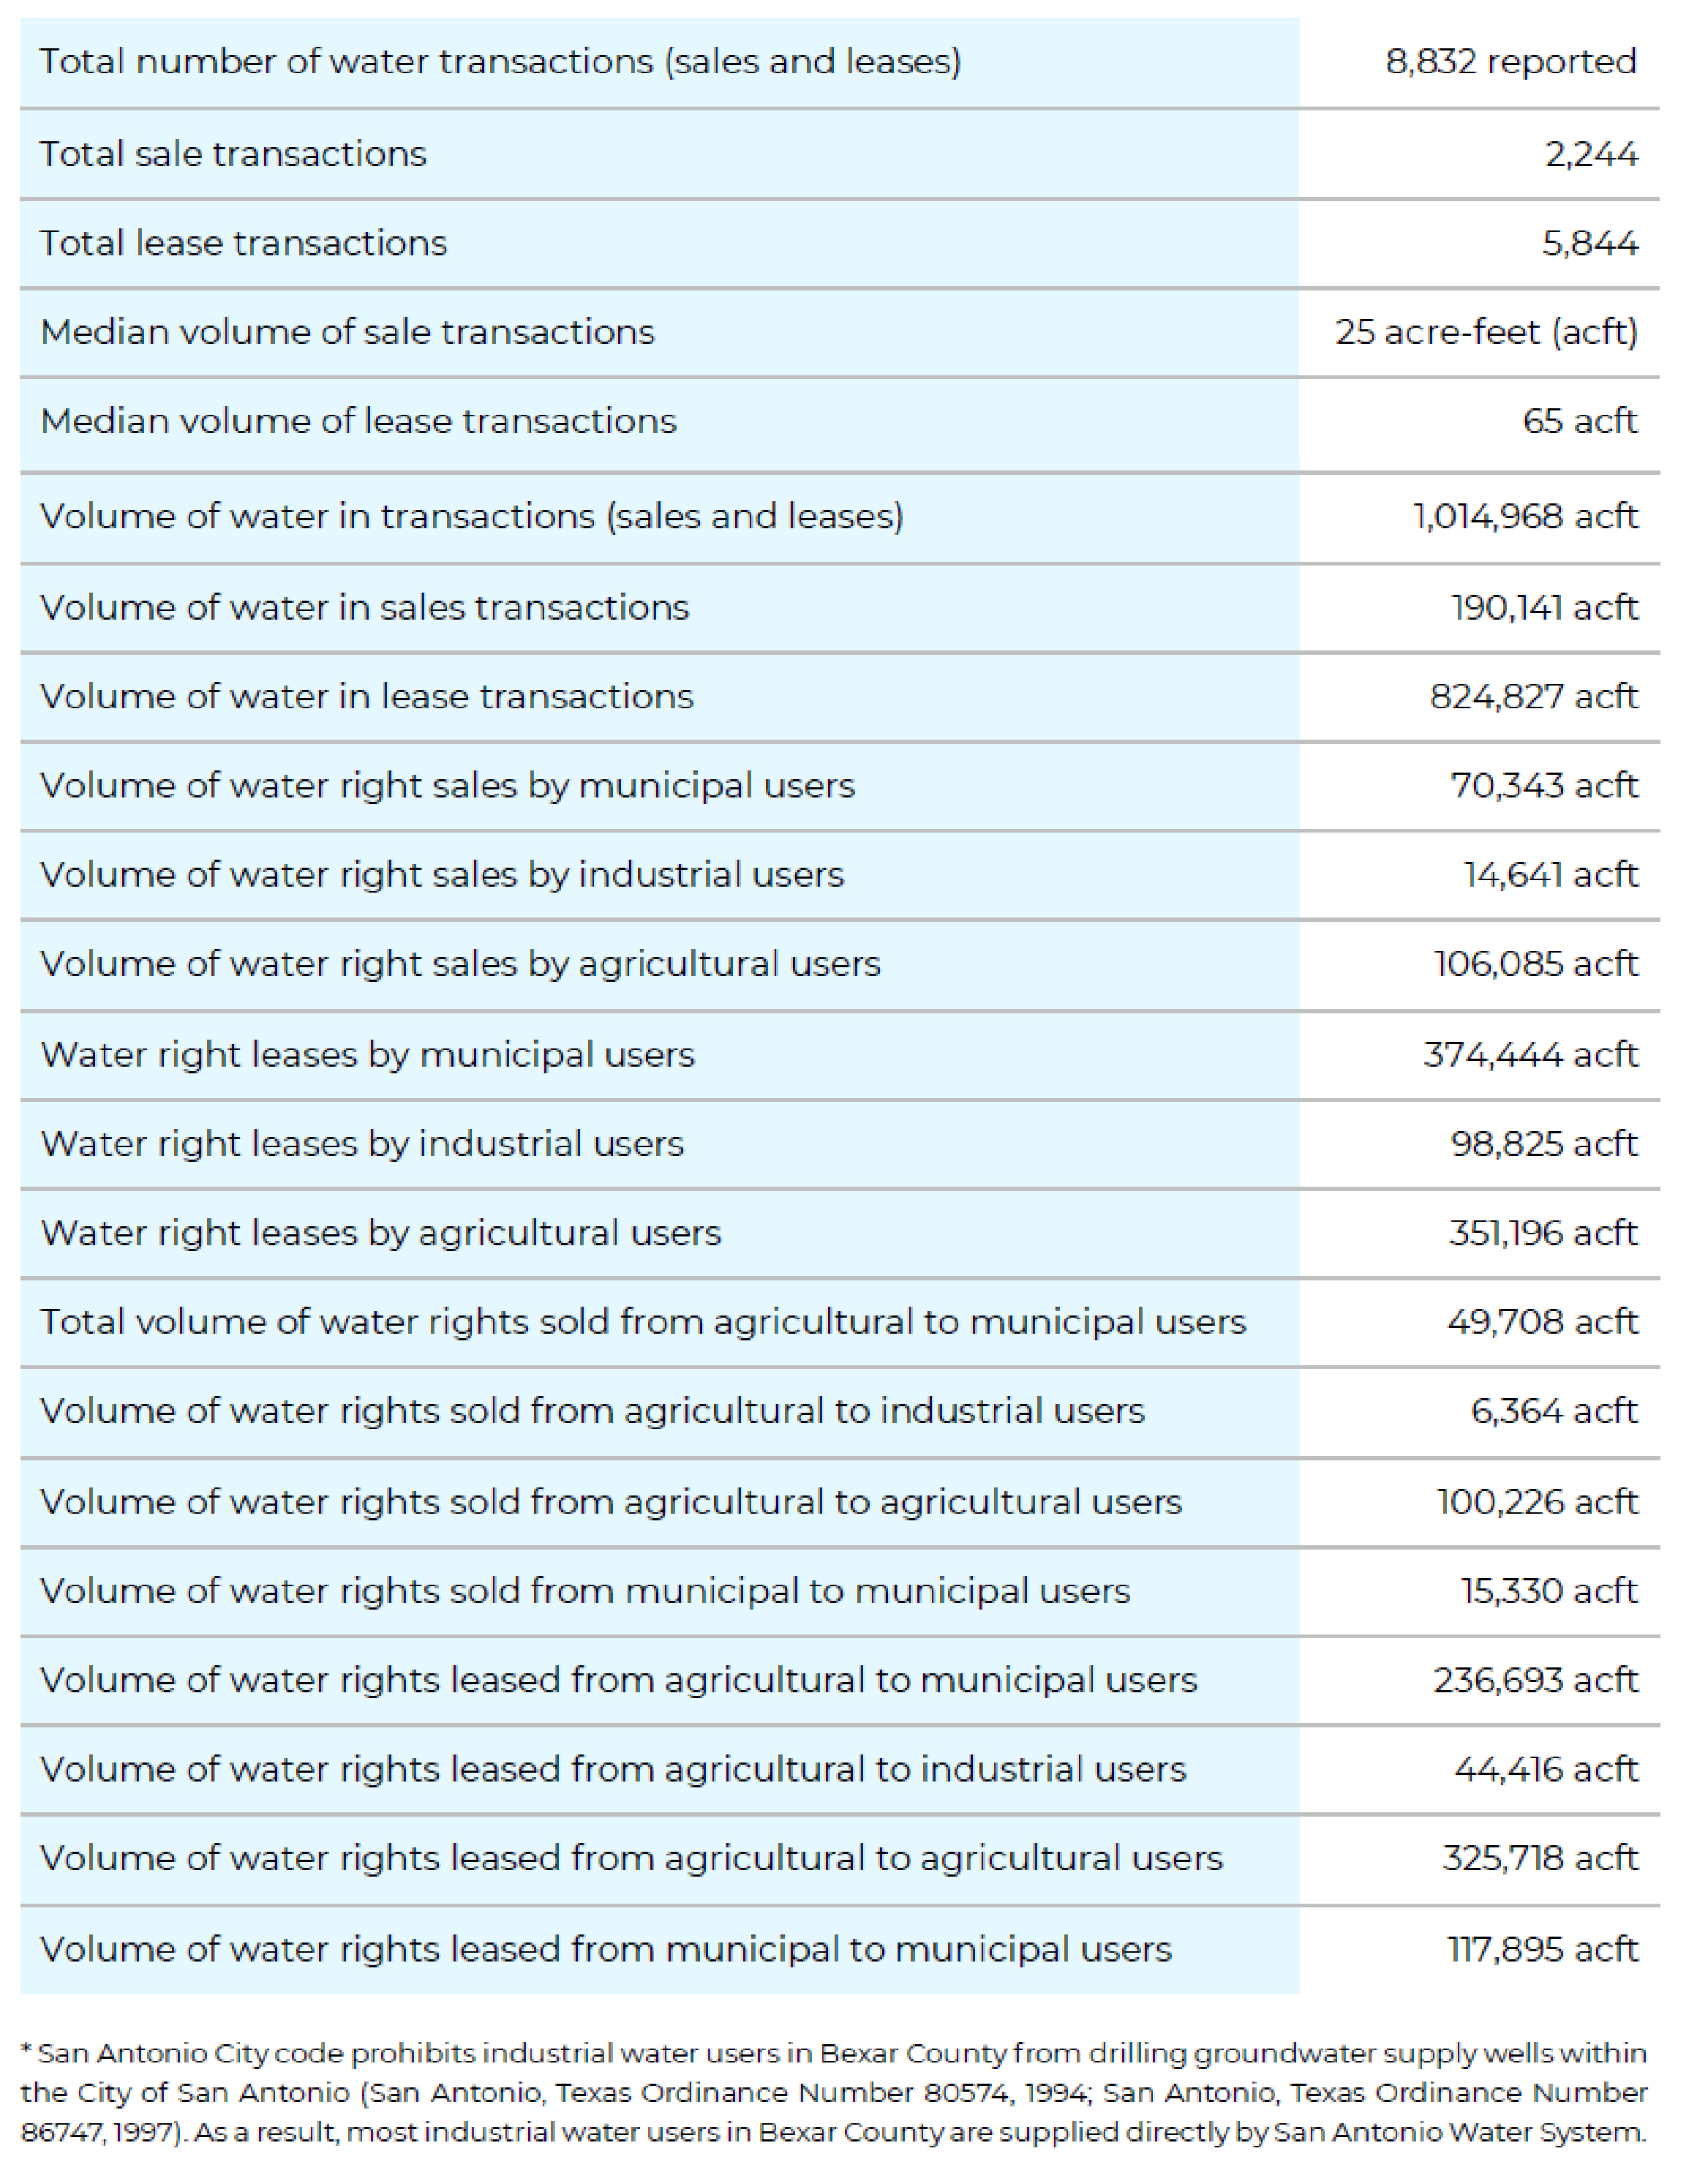
Table 2. Edwards Aquifer water market: Key values, 1997 – 2020 (Votteler et al., 2025).

