Listen here on Spotify | Listen here on Apple Podcast
Episode released on April 9, 2026
Episode recorded on February 20, 2026
 Nathalie Voisin discusses water-electricity interconnection, highlighting hydropower, hydropower droughts, grid reliability, and future of water-energy management.
Nathalie Voisin is the Chief Scientist for Regional Climate-Energy Dynamics at the Pacific Northwest National Laboratory, which is a US Department of Energy research center.
This podcast emphasizes strong interdependencies between water systems and electricity generation, especially under climate extremes.
Highlights | Transcript
U.S. Delegation to Kosovo
1. U.S. Delegation to Kosovo: Transboundary Water-Energy Systems
The Kosovo–Serbia reservoir case demonstrates that while modeling and optimization tools are useful, governance structures (e.g., river commissions) ultimately determine outcomes. Decisions depend on negotiation, shared priorities, and trust—not just engineering solutions.
2. Reservoirs provide multiple “river services” beyond hydropower
Reservoirs support irrigation, municipal supply, cooling for power plants, flood control, and economic activities (tourism/recreation). As in the U.S., hydropower is an enabling function rather than the primary purpose.
3. Thermoelectric generation can depend heavily on water systems
In Kosovo, ~95% of electricity generation depended indirectly on reservoir water via thermoelectric cooling. This underscores hidden dependencies in energy systems that appear decoupled from water but are fundamentally linked
4. Simple, practical resilience measures often outperform complex optimization models
Recommendations focused on reducing canal losses, improving storage redundancy, and enhancing inflow predictability, and a joint river commission, needed to guide future optimizing of expansion and operations—pure optimization cannot happen before a review of the infrastructure and of joint objectives, reflecting real-world constraints.
Role of Hydropower in the Western U.S. Electricity System
1. Hydropower underpins system economics beyond its energy share
Even when contributing a small fraction of total electricity, hydropower revenues finance reservoir maintenance, irrigation delivery, and other water services, making it economically foundational to system viability.
2. Water intensity metrics for hydropower are often misrepresented
Assigning all evaporation losses to hydropower is misleading because reservoirs serve multiple purposes. Proper accounting should allocate impacts across all uses, not just electricity generation.
3. Aging infrastructure requires long-term planning under uncertainty
Hydropower systems have ~100-year lifespans, requiring decisions today that must account for future climate, demand, technology changes, and monetization mechanisms.
4. Hydropower provides critical grid services beyond energy generation, including
a. Frequency regulation (maintaining 60 Hz)
b. Ramping flexibility
c. Long-duration storage
d. Black start capability
These services are essential for grid stability, especially with increasing renewables.
Water vs. Electricity System Fundamentals
1. Water and electricity have fundamental different constraints
• Water: easy to store, difficult to transport
• Electricity: easy to transmit, difficult to store
These differences drive infrastructure design and system interdependencies.
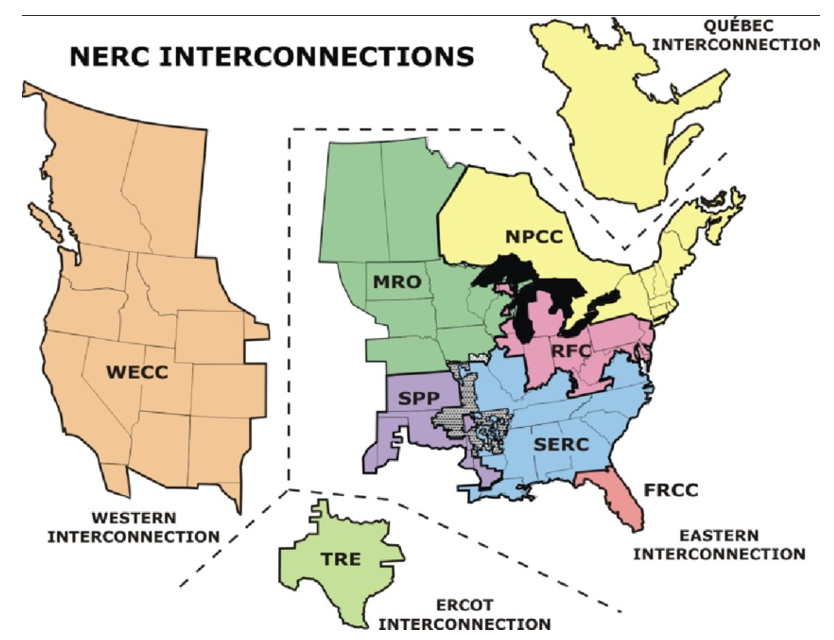
2. Electric grids enable “virtual water transfer” (Fig. 1)
Transmission networks (e.g., Western Electricity Coordination Council, WECC) allow electricity generated in water-rich regions to support dry regions—effectively transferring the value of water embedded in energy production.
3. Balancing authorities define operational constraints and regional reliability
Electricity systems prioritize local supply-demand balance within balancing authorities, with transmission as a secondary option. This creates regional differences in reserve requirements and system behavior.
Regional Interconnection & Climate Variability
1. Grid Interconnection enhances resilience through resource sharing.
Systems like the Western Interconnection (across 11 states) improve reliability by enabling energy exchange across regions with different climate and resource conditions.
2. Spatial variability is the foundation of reliability
Reliability depends on the fact that:
a. Some regions are wet while others are dry
b. Some have wind/solar while others do not
This diversity enables balancing across the grid.
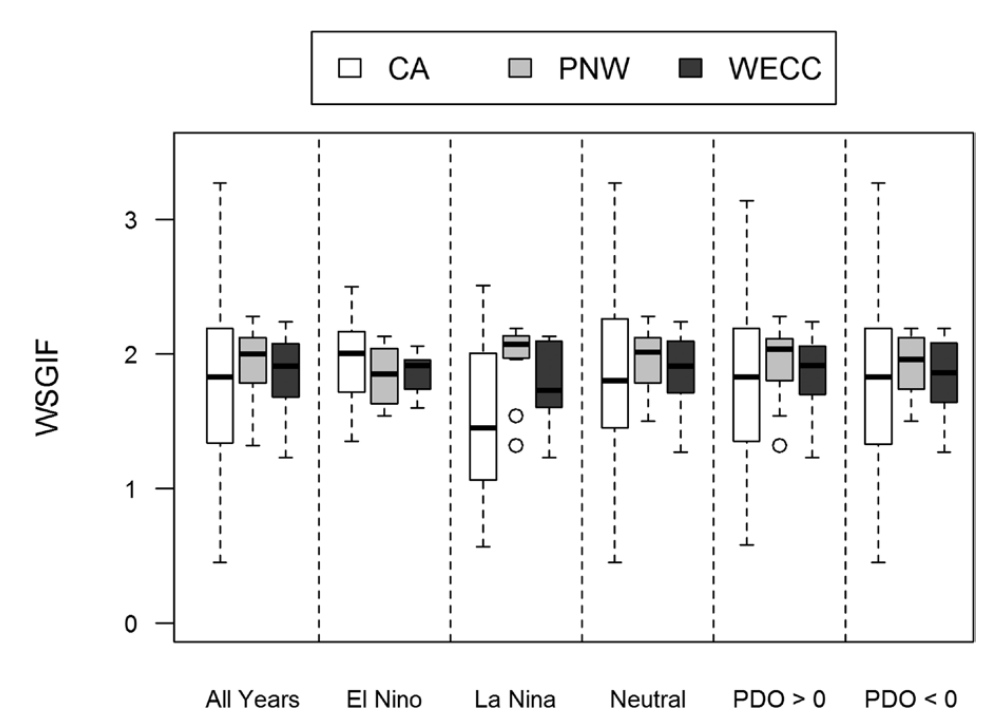
3. ENSO-neutral conditions can create the greatest system stress
Contrary to common expectations, the greatest grid stress occurs when all regions are simultaneously dry, such as during ENSO neutral periods, limiting the ability to import power (Fig. 2)
Energy Droughts & Renewable Integration
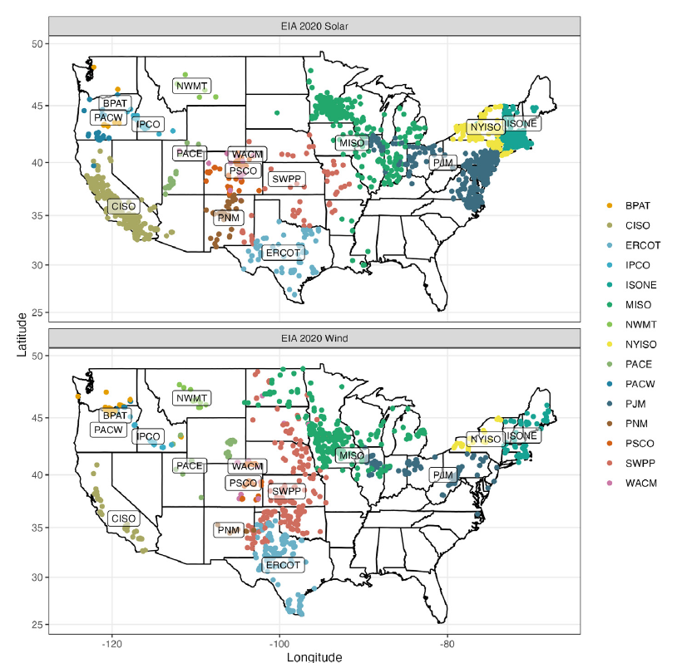
1. Droughts extend beyond hydrology to include renewables
Periods of low wind and solar generation can coincide with water shortages, creating compound energy deficits that challenge grid reliability. The distribution of solar and wind plants in balancing authorities in the CONUS is shown in Fig. 3.
2. Renewable expansion increases system complexity
Higher penetration of wind and solar increases variability, elevating the importance of storage, transmission, and flexible resources such as hydropower. Compound drought magnitude for different durations based on solar and wind plants throughout the CONUS is shown in Fig. 4.
3. Strategic siting of renewables is essential
Optimal placement should consider system-wide diversity and reliability, not just local resource quality. Poor siting can amplify energy drought risks.
Water Security & Energy System Tradeoffs (Voisin et al., Water Security, 2019)
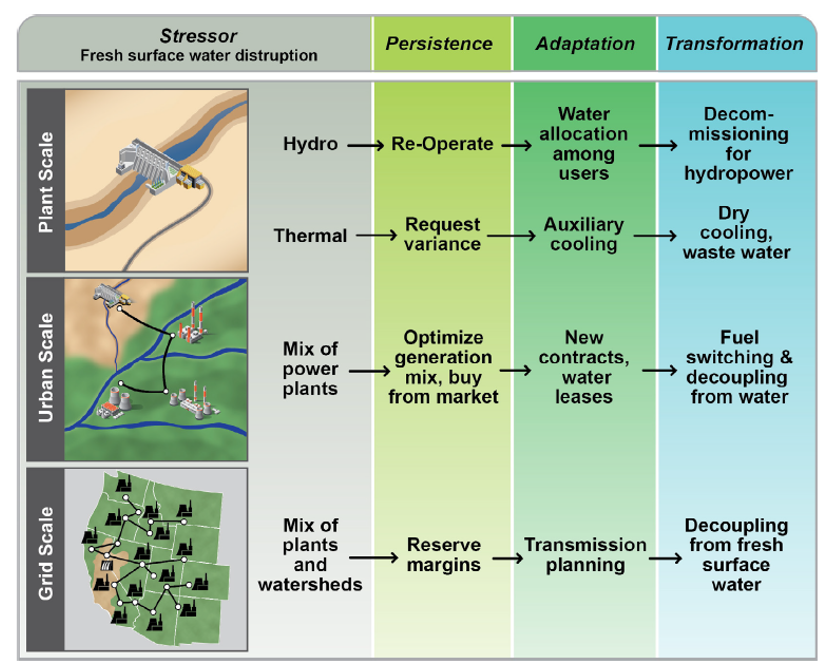
1. Water availability shapes energy decisions at multiple scales (Fig. 5)
- Plant level: water-energy dependency is very high, leading to less generation and less efficiency (cooling of thermo-electric) in times of drought. Operators manage for inter-annual variability. Consider disconnection from water possible.
- Watershed level: possibility of managing resources across power plants, alleviating the impact of droughts. This is an exercise of allocation and redistribution
- Grid level: transmission, market and long term contracts are used to alleviate drought impacts. The need to disconnect from water is much less needed when considered at the grid scale.
These multi-scale interactions define system performance and resilience, and the perception of the need to disconnect energy systems from water.
2. Tradeoffs define resilience strategies - Dry cooling → less water use but lower energy efficiency, need more power plants, raise cost
- Increased reserve margins improve reliability but raise costs
- Transmission expansion enhances flexibility but requires major investment
Decision making involves balancing cost, efficiency, and reliability.
3. Tipping points can trigger system transitions
Examples include: - Switching cooling technologies
- Retiring hydropower assets
- Disconnecting energy systems from water sources
Data, Modeling & Planning Frameworks
1. Historical records are insufficient for planning extremes
Observational datasets (~40 years) cannot capture full variability, requiring synthetic datasets and ensemble modeling to assess rare but critical events.
2. Probabilistic approaches are essential for reliability planning
Grid reliability depends on understanding the likelihood of extreme events rather than relying on average conditions.
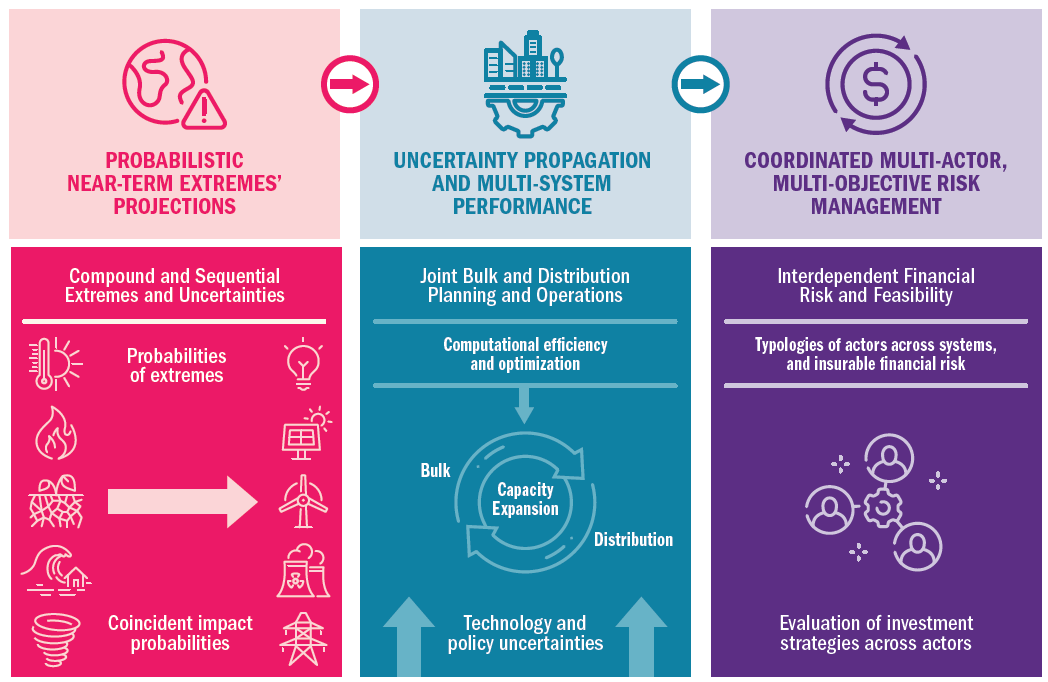
3. FORESIGHT (Framework for Optimizing Reliable Energy Systems and Infrastructure Given High-Uncertainty Trajectories) targets actionable planning horizons
- Focus shifts from long-term trends (to 2100) to near term (10 – 20 yr) extremes that are directly relevant for infrastructure and operational decisions.
FORESIGHT includes (Fig. 6): - Artificial intelligence–based weather and hydrology extreme-event emulators for probabilistic near-term planning
- Weather-to-grid deterministic and probabilistic impact models
- Innovative dissemination tool and access to libraries of extreme events and associated power-system-ready datasets
- Advanced algorithms for cross-system planning under compound risk
- Artificial intelligence–based modeling of interacting investor decisions under uncertainty to realize future infrastructure portfolios.
4. FORESIGHT provides catalogs of extreme events to support reliability studies. We have heat waves, energy droughts and hydropower droughts. Hydropower datasets have been the most used so far. Those datasets address tradeoff to reasonably represent the full grid footprint :
Monthly electricity generation was estimated for 1,500 hydroelectric power plants in the U.S. (Turner et al., Sci. Data, 2022) and later extended to weekly datasets (Bracken et al. 2025b).
Multi-year, weekly datasets (observed + simulated) support:
a. Reliability studies
b. Climate stress testing
c. Scenario comparisons
Visualization & System Understanding
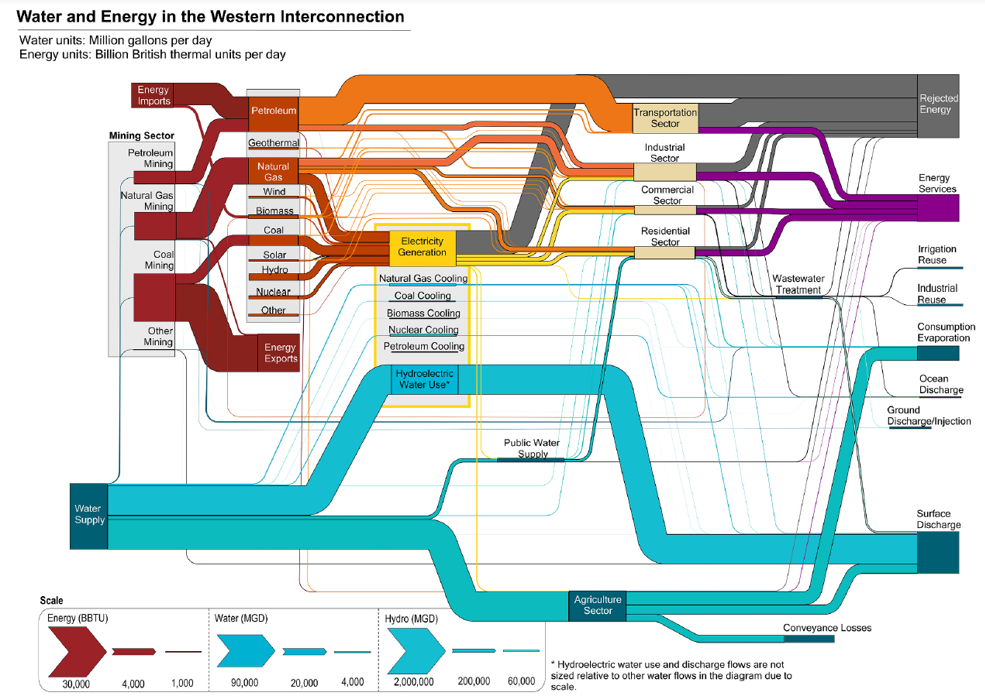
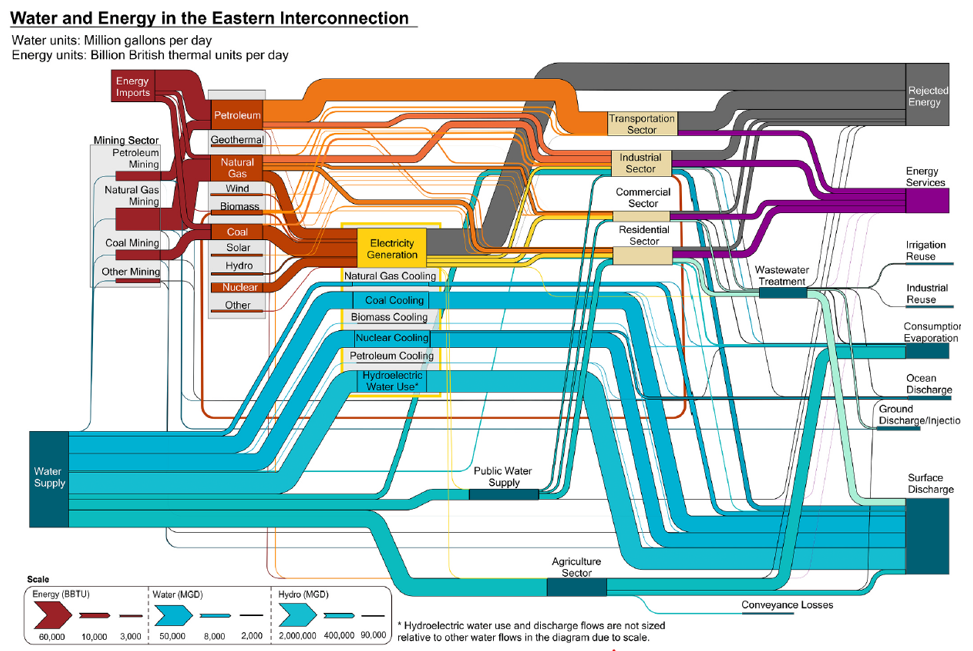
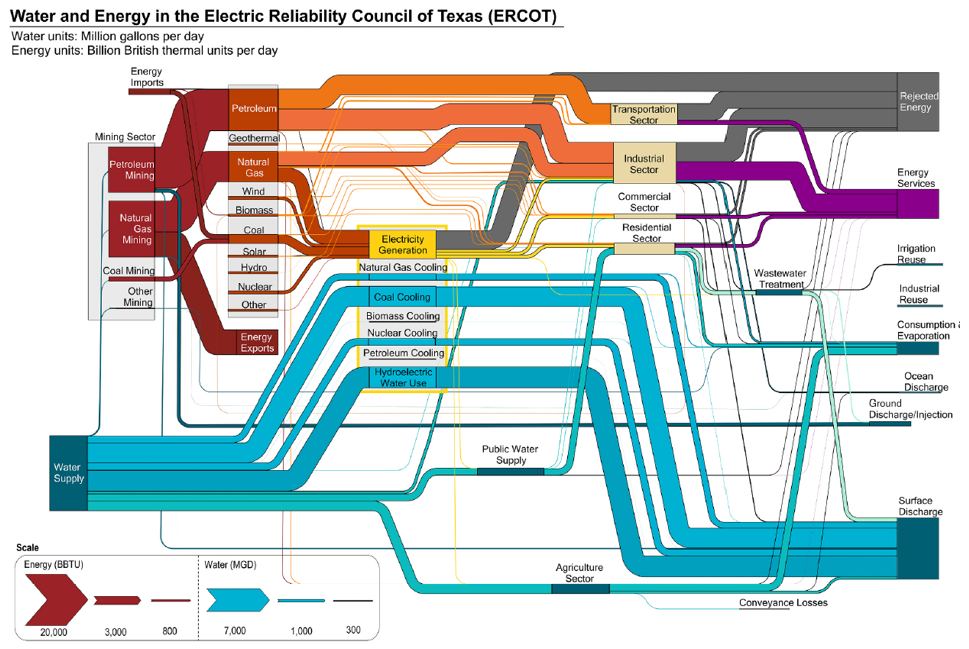
1. Sankey diagrams reveal water–energy interdependencies (Mongird et al., Utilities Policy, 2023) (Fig. 7a -c)
These diagrams map flows of:
a. Energy sources → uses
b. Water consumption → energy production
c. Sankey diagram can be oversimplified. For example, energy intensive irrigation and interbasin water transfers can impact electricity demand and increase risk of electricity disruptions.
Nonetheless, Sankey diagrams highlight regional differences in water-energy dependencies and system design choices. Those are a great starting point to define regional water-energy dependencies to work with stakeholders in times of droughts.
2. Regional differences are critical (Fig. 7a-c)
a. Western US: more hydropower, dry cooling and hence less water dependence for thermal plants
b. Eastern US: energy systems are designed around abundant water, especially for thermo-electric plant with once-through and wet cooling. Droughts are not as intense as in the Western US, especially as there is typically recovery from one year to another. Water quality if the major stressor.
c. Results highlight the need for integrated policy, planning, and management of energy and water resources based on regional interdependent systems perspective with different opportunities.
Future Challenges: Demand Growth & Infrastructure
1. Electricity demand growth is highly uncertain
Key drivers:
a. Data centers
b. Electrification (electricity vehicles, industry)
c. Policy changes
Demand uncertainty is a major challenge for planning.
2. Data centers introduce new water–energy tensions
Questions include siting, infrastructure investment, and balancing water use with energy efficiency. These facilities can significantly stress both systems.
3. Institutional and financial structures will shape system evolution
“Who pays for what” is defined by institutional and financial structures. Public vs. private ownership, market design, and investment strategies will determine opportunities and feasibility for how infrastructure adapts to growing demand and climate pressures.