Listen here on Spotify | Listen here on Apple Podcast
Episode released on March 12, 2026
Episode recorded on January 29, 2026

Podcast Note! Water Resources Podcast has been selected by FeedSpot as one of the Top 15 Texas Design Podcasts, as well as Top 50 Natural Resources Podcasts on the web! Thank You to all of our podcast guests and listeners. Together we are learning about water resources challenges and solutions! Now, on to today's episode:
Di Long discusses his research on the water resources in the Tibetan Plateau Asian Water Tower, reservoirs in the Mekong Basin, and water storage recovery in the North China Plain.
Di is a Professor in Hydrology and Remote Sensing at the Department of Hydraulic Engineering at Tsinghua University in Beijing. His research focuses on integrating satellite remote sensing, hydrological modeling, and AI-based data fusion to quantify terrestrial water storage, surface water dynamics, cryospheric processes, and human impacts on the water cycle.
Highlights | Transcript
Texas 2011 Drought
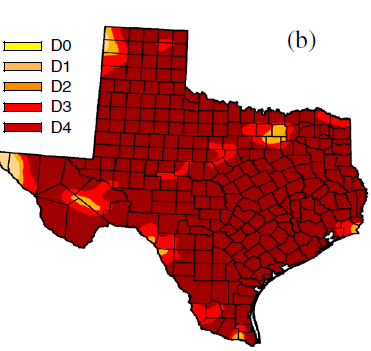
- GRACE satellites were used to monitor total water storage (TWS) depletion in Texas during the 2011 drought: the worst one-year drought on record (Figs. 1 and 2) (Long et al., GRL, 2013).
- GRACE satellite data show that Texas lost ~62 km³ of TWS, equivalent to ~50 million acre-feet (50 maf), about three times annual state water use (2023: 15 maf).
- Reservoir storage loss was ~7.6 km³ (~12% of TWS decline).
- Groundwater pumping accounted for ~8–16% of total depletion.
- Soil moisture depletion from various models was highly variable.
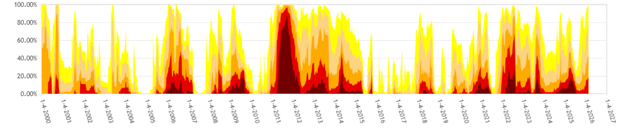
- Palmer Drought Severity Index (PDSI) dropped below –2 for over a year, reaching nearly –8 at the drought peak.
- Full hydrologic recovery required record rainfall in 2015, reflecting large soil moisture deficits (Fig. 2).
Tibetan Plateau (“Asian Water Tower,” Third Pole, Critical Headwaters Region)
- The Tibetan Plateau (~3 million km², >4,000 m elevation) supplies water to >1 billion people via rivers including the Yangtze, Yellow, Mekong (Lancang), Salween, Brahmaputra, Indus, and Ganges.
- Rapid Lake Expansion (2000–2017)
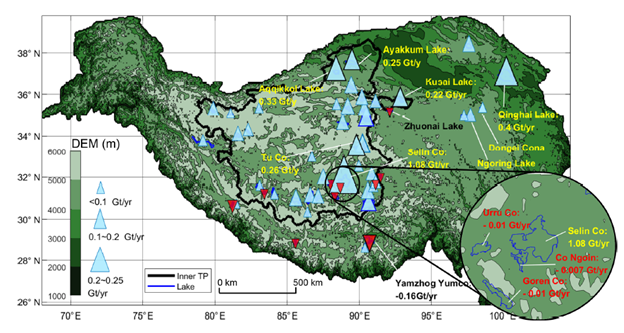
- Analysis of ~50 lakes (>100 km²) showed 5–10 m water level increases over 17 years based on altimetry and Landsat data (2000–2017) (Fig. 3) (Li et al., ESSD, 2019).
- Endorheic basins (internally draining basins) gaining water, ~5–6 km³/yr, driven by increased precipitation and glacier melt.
- Exorheic basins losing storage
- Southern basins feeding major rivers lost ~16 km³/yr due to glacier mass loss and climate shifts.
- Monsoon–Westerlies Shift Controls Regional Trends: Weakened South Asian monsoon and strengthened westerlies explain north–south hydrologic divergence, gaining in the North and losing in South.
- GRACE satellite data indicate that Total Water Storage (TWS) decreased by 10 km3 over the Tibetan Plateau (2002–2017) (Li et al., NCC, 2022).
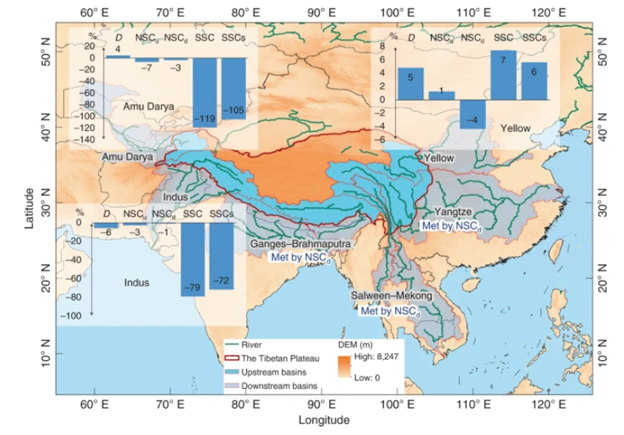
- The impacts of future climate change on water storage suggest excessive water declines, particularly in the Amu Darya and Indus river basins, potentially impacting millions of people downstream.
- Vulnerability of populated downstream areas was evaluated based on water demand relative to the natural supply capacity and storage supply capacity, showing that the Amu Darya and Indus are highly vulnerable to shortages in the future. (Fig. 4) (link).
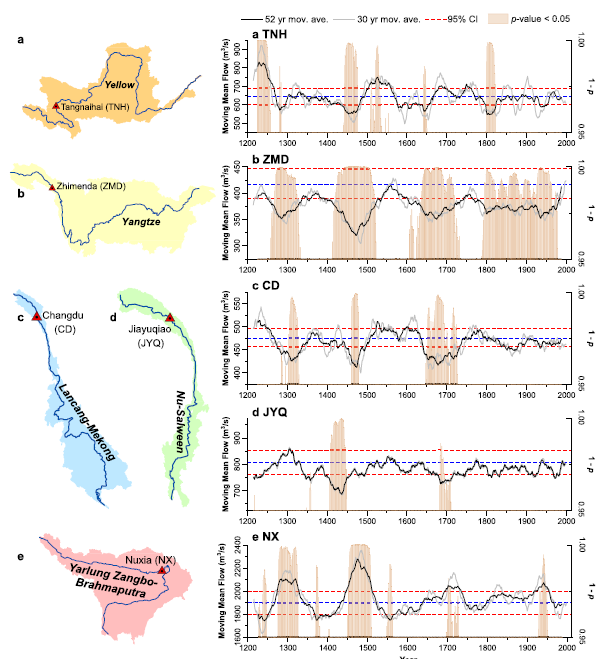
- Reconstructed 800 year (1200–2012 C.E.) annual streamflow in five headwaters in the SE Tibetan Plateau (Wu et al., NC, 2022).
- The reconstruction was based on the Monsoon Asia Drought Atlas which provides gridded Palmer Drought Severity Index (PDSI) based on tree rings calibrated against instrumental streamflow records (1960–2012) (Fig. 5).
- The reconstructions revealed contrasting regional patterns in the northern (Yellow, Yangtze, and Lancang-Mekong) and southern (Nu-Salween and Yarlung Zangbo-Brahmaputra) SE Tibetan Plateau, with wet in the north corresponding to dry in the south (dividing line ~32°−33°N).
- The reconstructions show many periods in the past that exceed the instrumental identified.
Lancang-Mekong River
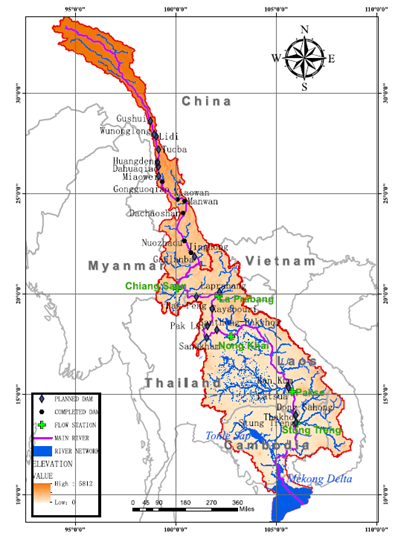
- The Mekong River originates in the Tibetan Plateau (~800,000 km2) and flows through six countries (Fig. 6).
- Dams on the Lancang-Mekong in China are used for hydroelectricity, accounting for ~1% of total electricity generation in China.
- Dam impacts depend on the development phase:
- Pre-impact (1916–1991): climate-dominated flows
- Filling phase (1990–2009): reduced annual discharge in upstream gage but no apparent impact on downstream gage
- Post-2010 operations: near-natural annual totals but altered seasonal timing
- Dams reduce flooding and increase flows during droughts downstream.
- Dams also affect sediment transport and the Mekong Delta.
North China Plain
- The North China Plain is one of the most important agricultural regions in China and also hosts large cities, including Beijing and Tianjin with intensive irrigation of winter wheat during the dry season.
- The Middle route (1200 km) of the South to North Water Diversion transfers water from the Yangtze River (Dangjiangkou Reservoir) to the North China Plain, supplying Beijing, Tianjin, and major cities.
- The SNWD delivered 45 km3 of water between 2015 and 2024.
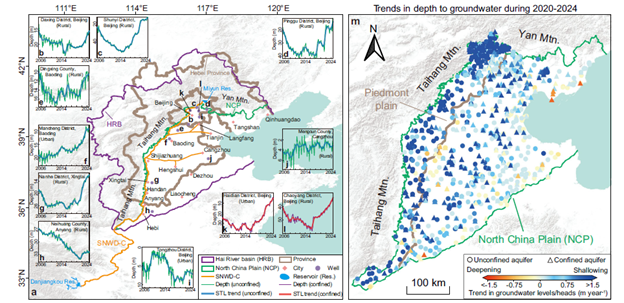
- There has been unprecedented groundwater recovery in the North China Plain (Fig. 7, Long et al., NC, 2025).
- Historical groundwater declines of 20–60 m (~180 km³ cumulative loss)
- Losses from 2–5 km3/yr
- Post-2020 recovery of ~6.5 km³/yr
- Recovery attributed to 45% increased precipitation, 30% water diversion, 25% conservation/demand management
- From 2005 to 2023, these policies reduced annual groundwater abstraction by ~12 km3 and increased environmental water allocations to over 7 km3 since 2021, promoting aquifer recharge and restoring environmental flows.
Cross-Cutting Innovation: AI/ML + Satellite Fusion
- Satellite data often provide high spatial/low temporal resolution or vice versa.
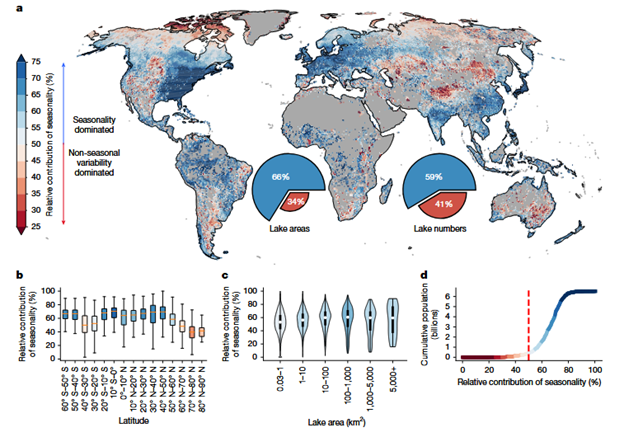
- U-Net-based AI fuses multi-sensor satellite data (e.g., temporal vs spatial trade-offs) to monitor 1.4 million lakes globally (Li et al., Nature, 2025).
- AI/ML approach enables decomposition of lake dynamics into long-term trends, interannual variability, and seasonality (Fig. 8).