Listen here on Spotify | Listen here on Apple Podcast
Episode released on August 21, 2025
Episode recorded on April 25, 2025
 Jamon Van Den Hoek discusses mapping real time conflict using satellites and ground-truthing with journalists.
Jamon Van Den Hoek is a Professor of Geography at Oregon State University and leads the Conflict Ecology Lab.
Highlights | Transcript
Jamon Van Den Hoek and his team recently won the 2025 Earth Observation Excellence Award from the European Space Agency as part of the Decentralized Damage Mapping Group, which uses Earth observation datasets to assess damage in conflict and disaster-affected regions.
Gaza Strip
- Gaza has an area of 365 km2, 41 km long and 6 – 12 km wide, similar to Delaware in US.
- Population was 2.1 million in 2024, 1.6 M Palestinian refugees.
- Background: Hamas launched an attack on Israel on Oct. 7, 2023, killing more than 1,200 Israelis and other nationals and taking more than 250 people hostage (Ulbricht et al., 2025).
- Israel’s attack on Gaza represents a total war, affecting the entire country. People have not been able to leave Gaza.
- Water Conflict Chronology includes reference to several impacts on water systems:
- Israel invaded Gaza on Oct. 12, 2024, damaging one reservoir and desalination plant, serving 1.1 million people.
- Israeli warplanes destroy a water desalination plant (Dec 22, 2023)
- Israeli military pumps seawater into Hamas’ tunnel complex in Gaza
- Israeli air strikes destroy part of the energy production system, including solar panels, that provided energy for the Gaza Central Wastewater Treatment Plant. The plant served 11 communities and one million people.
- Last desalination plant (out of 4) shuts down due to lack of fuel.
- Impacts on Water, Sanitation, and Hygiene (WASH) infrastructure and related health effects are described in Perlman et al. (2025) (Fig. 1), indicating that about half of the sites had been damaged, including desalination plants, water pumping stations and water towers. Data used include OpenStreetMap (OSM), Humanitarian OpenStreetMap Team (HOT) and others.
- Earlier conflicts in Gaza occurred over many years: 2007- 2008, 2013 – 2014, and 2021 (Water Conflict Chronology):
- ~ 800,000 people in Gaza lack regular access to piped water related to the 11-day fighting in 2021 that damaged ~ half of the water network or cut off electricity required for the water system. Gaza municipality authorities say in a statement that 290 water-supply facilities, including the only desalination plant in northern Gaza, were damaged during the attack. (Water Conflict Chronology)
- Remote sensing approach
- Sentinel 1 radar data from European Space Agency used to map urban damage and buildings
- C band Synthetic Aperture Radar, not affected by clouds provides information on structural damage.
- Sentinel data are released about 1/6 days, need consistent view angle. The resolution of Sentinel 2 data is ~10- 30 m considering orbital mechanics issues and geometry and especially when comparing images etc.
- Satellite data used to develop coherent change detection results in ~ 40 m working resolution with Sentinel 1 data because it requires multiple looks.
- PlanetScope satellite data are also used to map urban areas, available subdaily but aggregated to weekly or monthly, nominal resolution 4 – 5 m
- They work with journalists to validate the remote sensing imagery and help interpret the imagery (NPR report, Oct. 10, 2024; Fig. 2).
- Agricultural land has been damaged greatly in Gaza since Oct. 2023 evaluated using PlanetScope and Planet SkySat (0.5 m resolution) imagery (Yin et al., SRS, 2025). Planet SkySat is similar to Google Earth base maps. Results show that 64–70% of tree crop fields and 58% of greenhouses had been damaged by 27 September 2024, after almost one year of war in the Gaza Strip.
- Although conflict information is collated by ACLED (Armed Conflict Location and Event Data) data latency is too great to provide real time information.
- Jamon and his team work closely with OpenStreetMap people and the Humanitarian Open Street Map Team (HOT). They are entirely voluntary and provide footprints of roadways and buildings. These sources included ~ 150,000 more buildings than Microsoft Footprint or Google Maps.
- The Gaza area relies on the Coastal Aquifer for ~ 90% of its water, depleting groundwater and resulting seawater intrusion. Groundwater is heavily polluted from seawater intrusion and sewage and chemical infiltration (Hall et al., CSIS, the Siege of Gaza’s Water, 2024), Fig. 4).
- Raw water from Gaza was polluting Zikim Beach in Israel near the border with Gaza.
- Seawater in the Mediterranean may have been improved along the coast of Gaza because less wastewater is collected and discharged to the coast. Also fish may be returning to the region.
- Various plans being put forward for recovery of the Gaza Strip, such as those by the White House, RAND, Middle Eastern States.
Ukraine
- War in Ukraine differs from Gaza Strip, front line water rather than total war.
- Ukraine war:
- Estimated 250,000 Russian soldiers have died in Ukraine (CSIS, June 2025)
- Ukraine troop deaths ~ 500,000 (Jan 2025), Congressional report.
- Civilian fatalities: Russia, 388 killed; Ukraine, 12,500 killed (Russia Matters, Feb. 2025)
- Worked with NYT reports to develop a visual story of damage (Hernandez et al., NYT, Jun 3, 2204)
- Ukraine damage mapping includes:
- Urban damage
- Agricultural damage
- Kakhovka dam collapse
- Damage mapped using Sentinel 1 InSAR data, ~ two thirds of damage within 10 km of the front line (Scher and Van Den Hoek, SRS, 2025).
- Unexploded ordinances mapped like trees using WorldView 2 0.5 m resolution imagery and deep learning (Duncan et al., SRS, 2023).
Uganda
- Uganda ranks 5th in terms of hosting refugees with ~ 1.7 million refuges (UNHCR).
- NASA project co-led with Jamon Van Den Hoek, Catherine Nakalembe (Univ. MD), and Jen Alix-Garcia (OR State Univ.).
- The goal of this NASA project is to map vegetation dynamics within and surrounding refugee settlements, assess changes in agriculture, and evaluate land degradation.
- Ugandan policy: provides refugees with access to land for gardening, building a home and producing food. Kenya has similar policies (e.g., Kakuma refugee camp)
- Mapping this agriculture challenging because of small plot sizes but Sentinel 2 has been mostly used for mapping land use/land cover change.
- Linking mapping with market dynamics and food price data
- Validation of remote sensing mapping of agricultural production using Crop Harvest. Jamon Van Den Hoek has a field project in Uganda to visit refugee sites and delineate agricultural boundaries and evaluate crop types.
- Refugees often live in camps for more than a decade. The protracted refugee scenario refers to long-term refugees (> 20 years). Providing food, water, education and healthcare to these communities is very challenging. Some of the refugee camps extend back to the 1960s or 1980s.
- Assessing the reliability of mapping refugee camps in Uganda where refugee boundaries are well delineated. Testing six different data sets showed that the best estimate of the built up area was 40 – 50%. The Global Human Settlement Team greatly improved the data (Pesaresi et al., IJODE, 2024).
The Sustainable Development Goals are not mapped within refugee camps. His team evaluated various SDGs using Open Street Map (OSM) (Van Den Hoek, IJOGI, 2021).
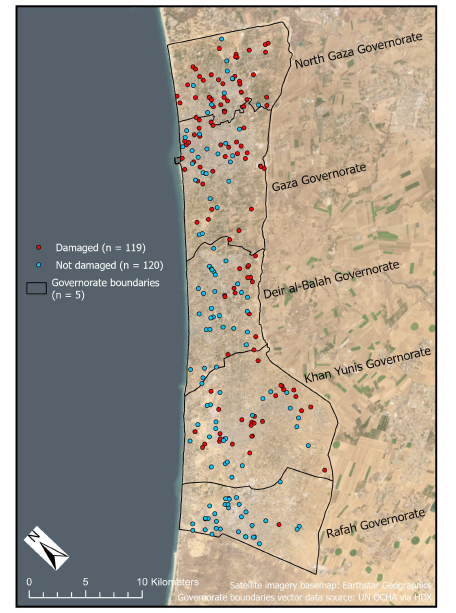
Figure 1. Map of WASH infrastructure sites assessed for damage (n = 239) (Perlman et al., 2025). Red points indicate damaged infrastructure (n = 119) and blue points indicate non-damaged infrastructure (n = 120). Governorate boundaries vector data source: UN OCHA via Humani¬tarian Data Exchange. 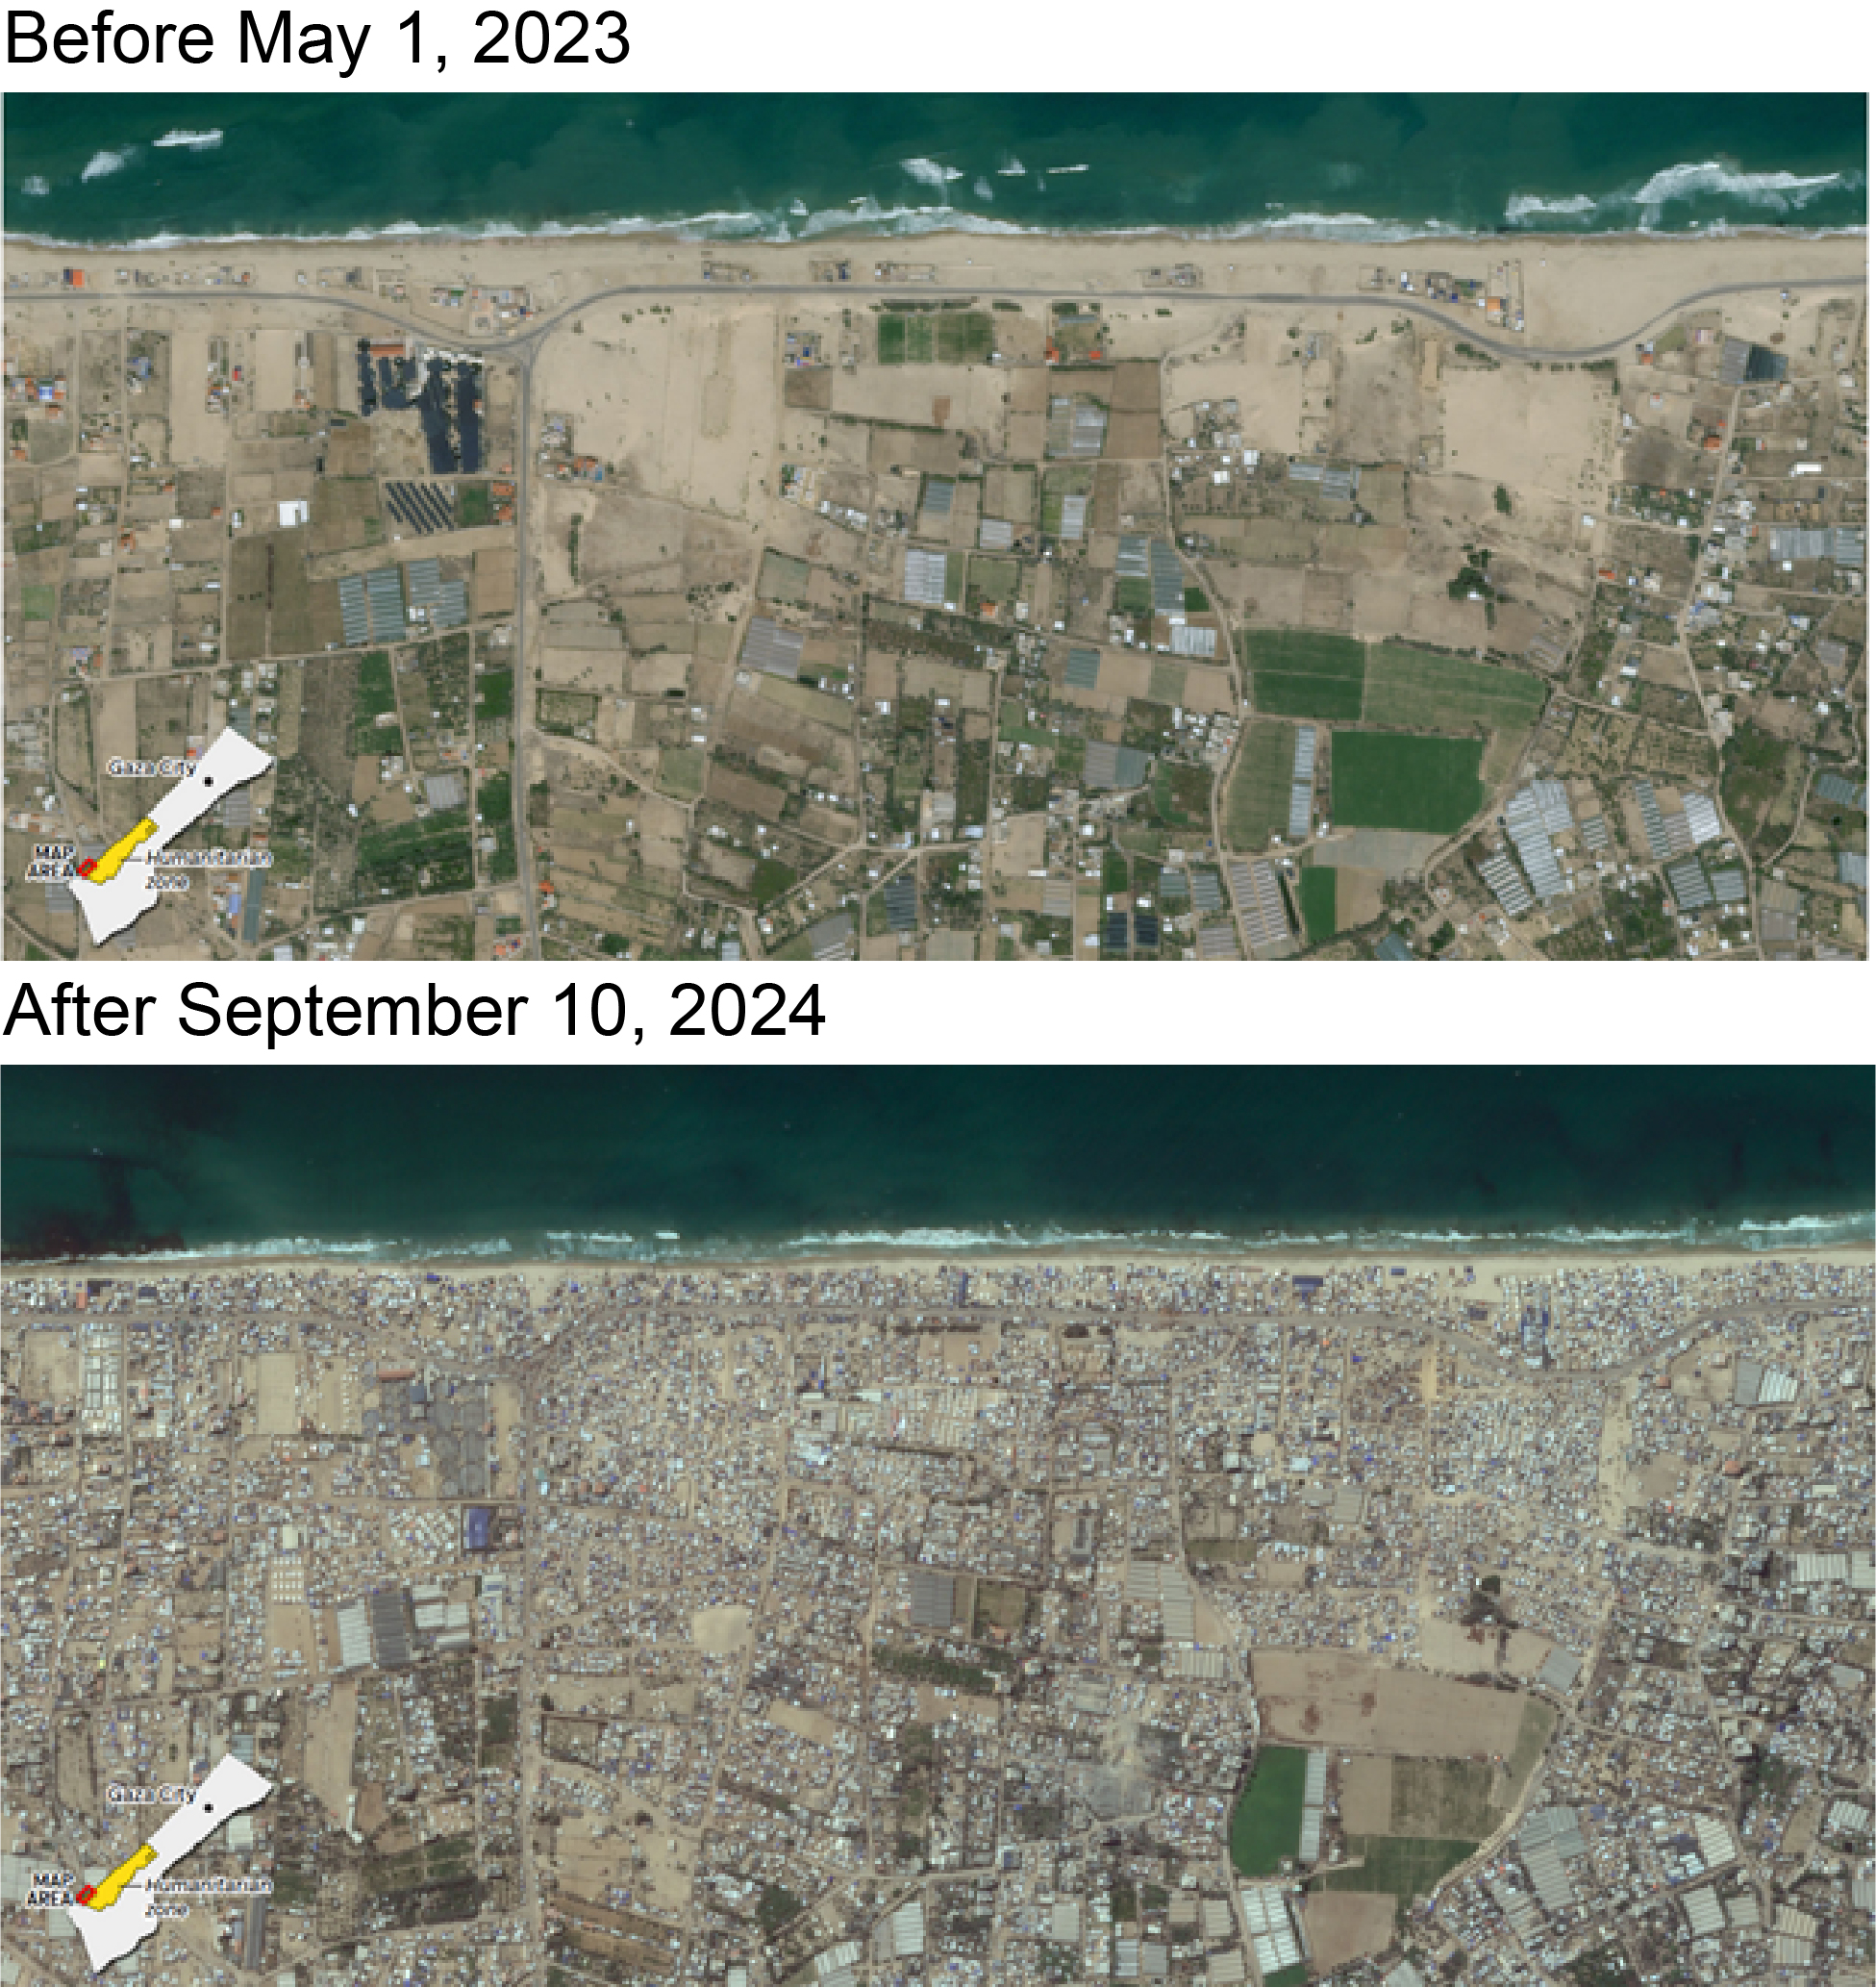
Figure 2. Planet Labs data showing crowding of refugee camps in the al-Mawasi humanitarian zone (Daniel Wood, NPR). 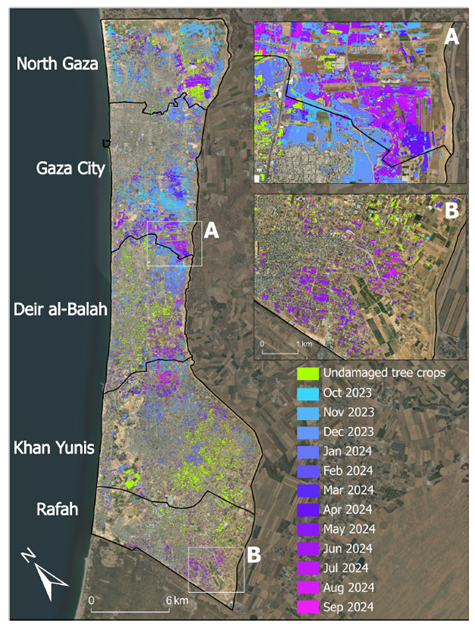
Figure 3. Tree crops damage at monthly intervals from October 2023 to September 2024. The months in which damage first occurred are in blue and purple colors, while undamaged tree crops are shown in green. Results show that 64–70% of tree crop fields and 58% of greenhouses had been damaged by 27 September 2024, after almost one year of war in the Gaza Strip. (Yin et al., 2025). 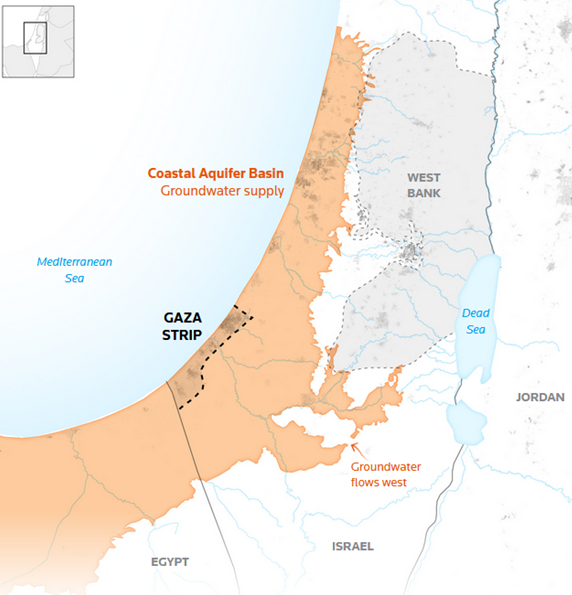
Figure 4. The Coastal Aquifer relative to the Gaza Strip from the Intl. Groundwater Resources Assessment (IGRAC), Global Humanitarian Settlement (European Commission), Natural Earth, and Open Street Map (Bhandari et al., Reuters, Oct. 16, 2023). 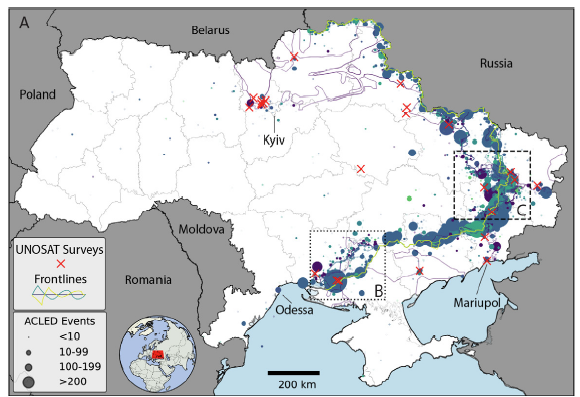
Figure 5. Armed Conflict Location and Event Data (ACLED) on ‘‘Remote violence’’ events at the settlement level in Ukraine (Sher and Van Den Hoek, SRS, 2025). Markers are scaled in area by the number of events from February 28, 2022 and October 31, 2023 and colored by the month where the most events were reported. 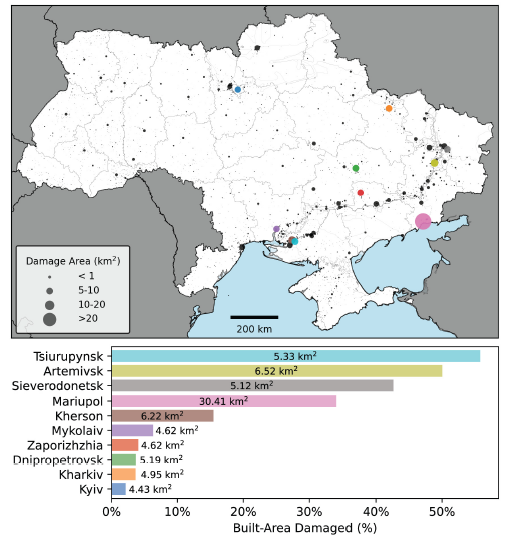
Figure 6. Aggregate damage in Ukraine detected during March 2022 – October 2024 using InSAR data. Point markers on the map are scaled by the area of damage detected. The percent of built-area in each settlement detected as damage is shown as a bar plot and total damaged area is printed for each settlement on or adjacent to each bar (Scher and Van Den Hoek, RSR, 2025).

