Listen here on Spotify | Listen here on Apple Podcast
Episode released on January 29, 2026
Episode recorded on November 6, 2025

Sergii Skakun discusses northward expansion of winter wheat production with climate change in Russia and Ukraine.
Sergii Skakun is a professor with a joint appointment in the Department of Geographical Sciences and in the College of Information at the University of Maryland. He is the Agricultural Statistics Lead at the NASA Harvest program and NASA Acres programs. He is discussing applications of remote sensing to map expansion of agriculture in Ukraine and Russia related to climate change and also impacts of the Russian invasion in the Ukraine.
Highlights | Transcript
History and Agricultural Production
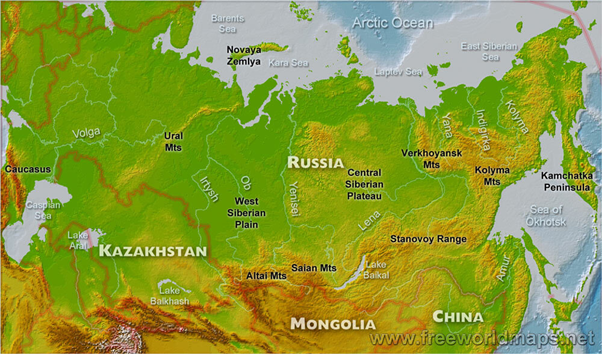
- Russia has an area of 17 million km2 in comparison with U.S. area of 8 million km2. Area of Ukraine ~604,000 km2. The dominant physical features are shown in Fig. 1 with the Urals separating European Russia from Asian Russia.
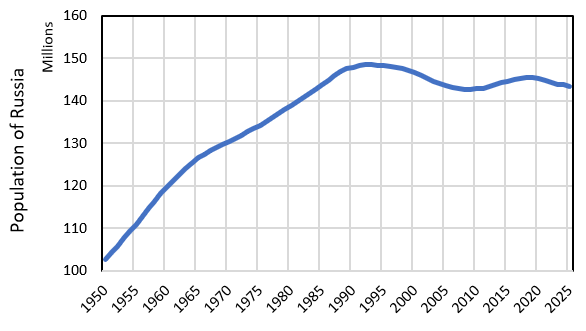
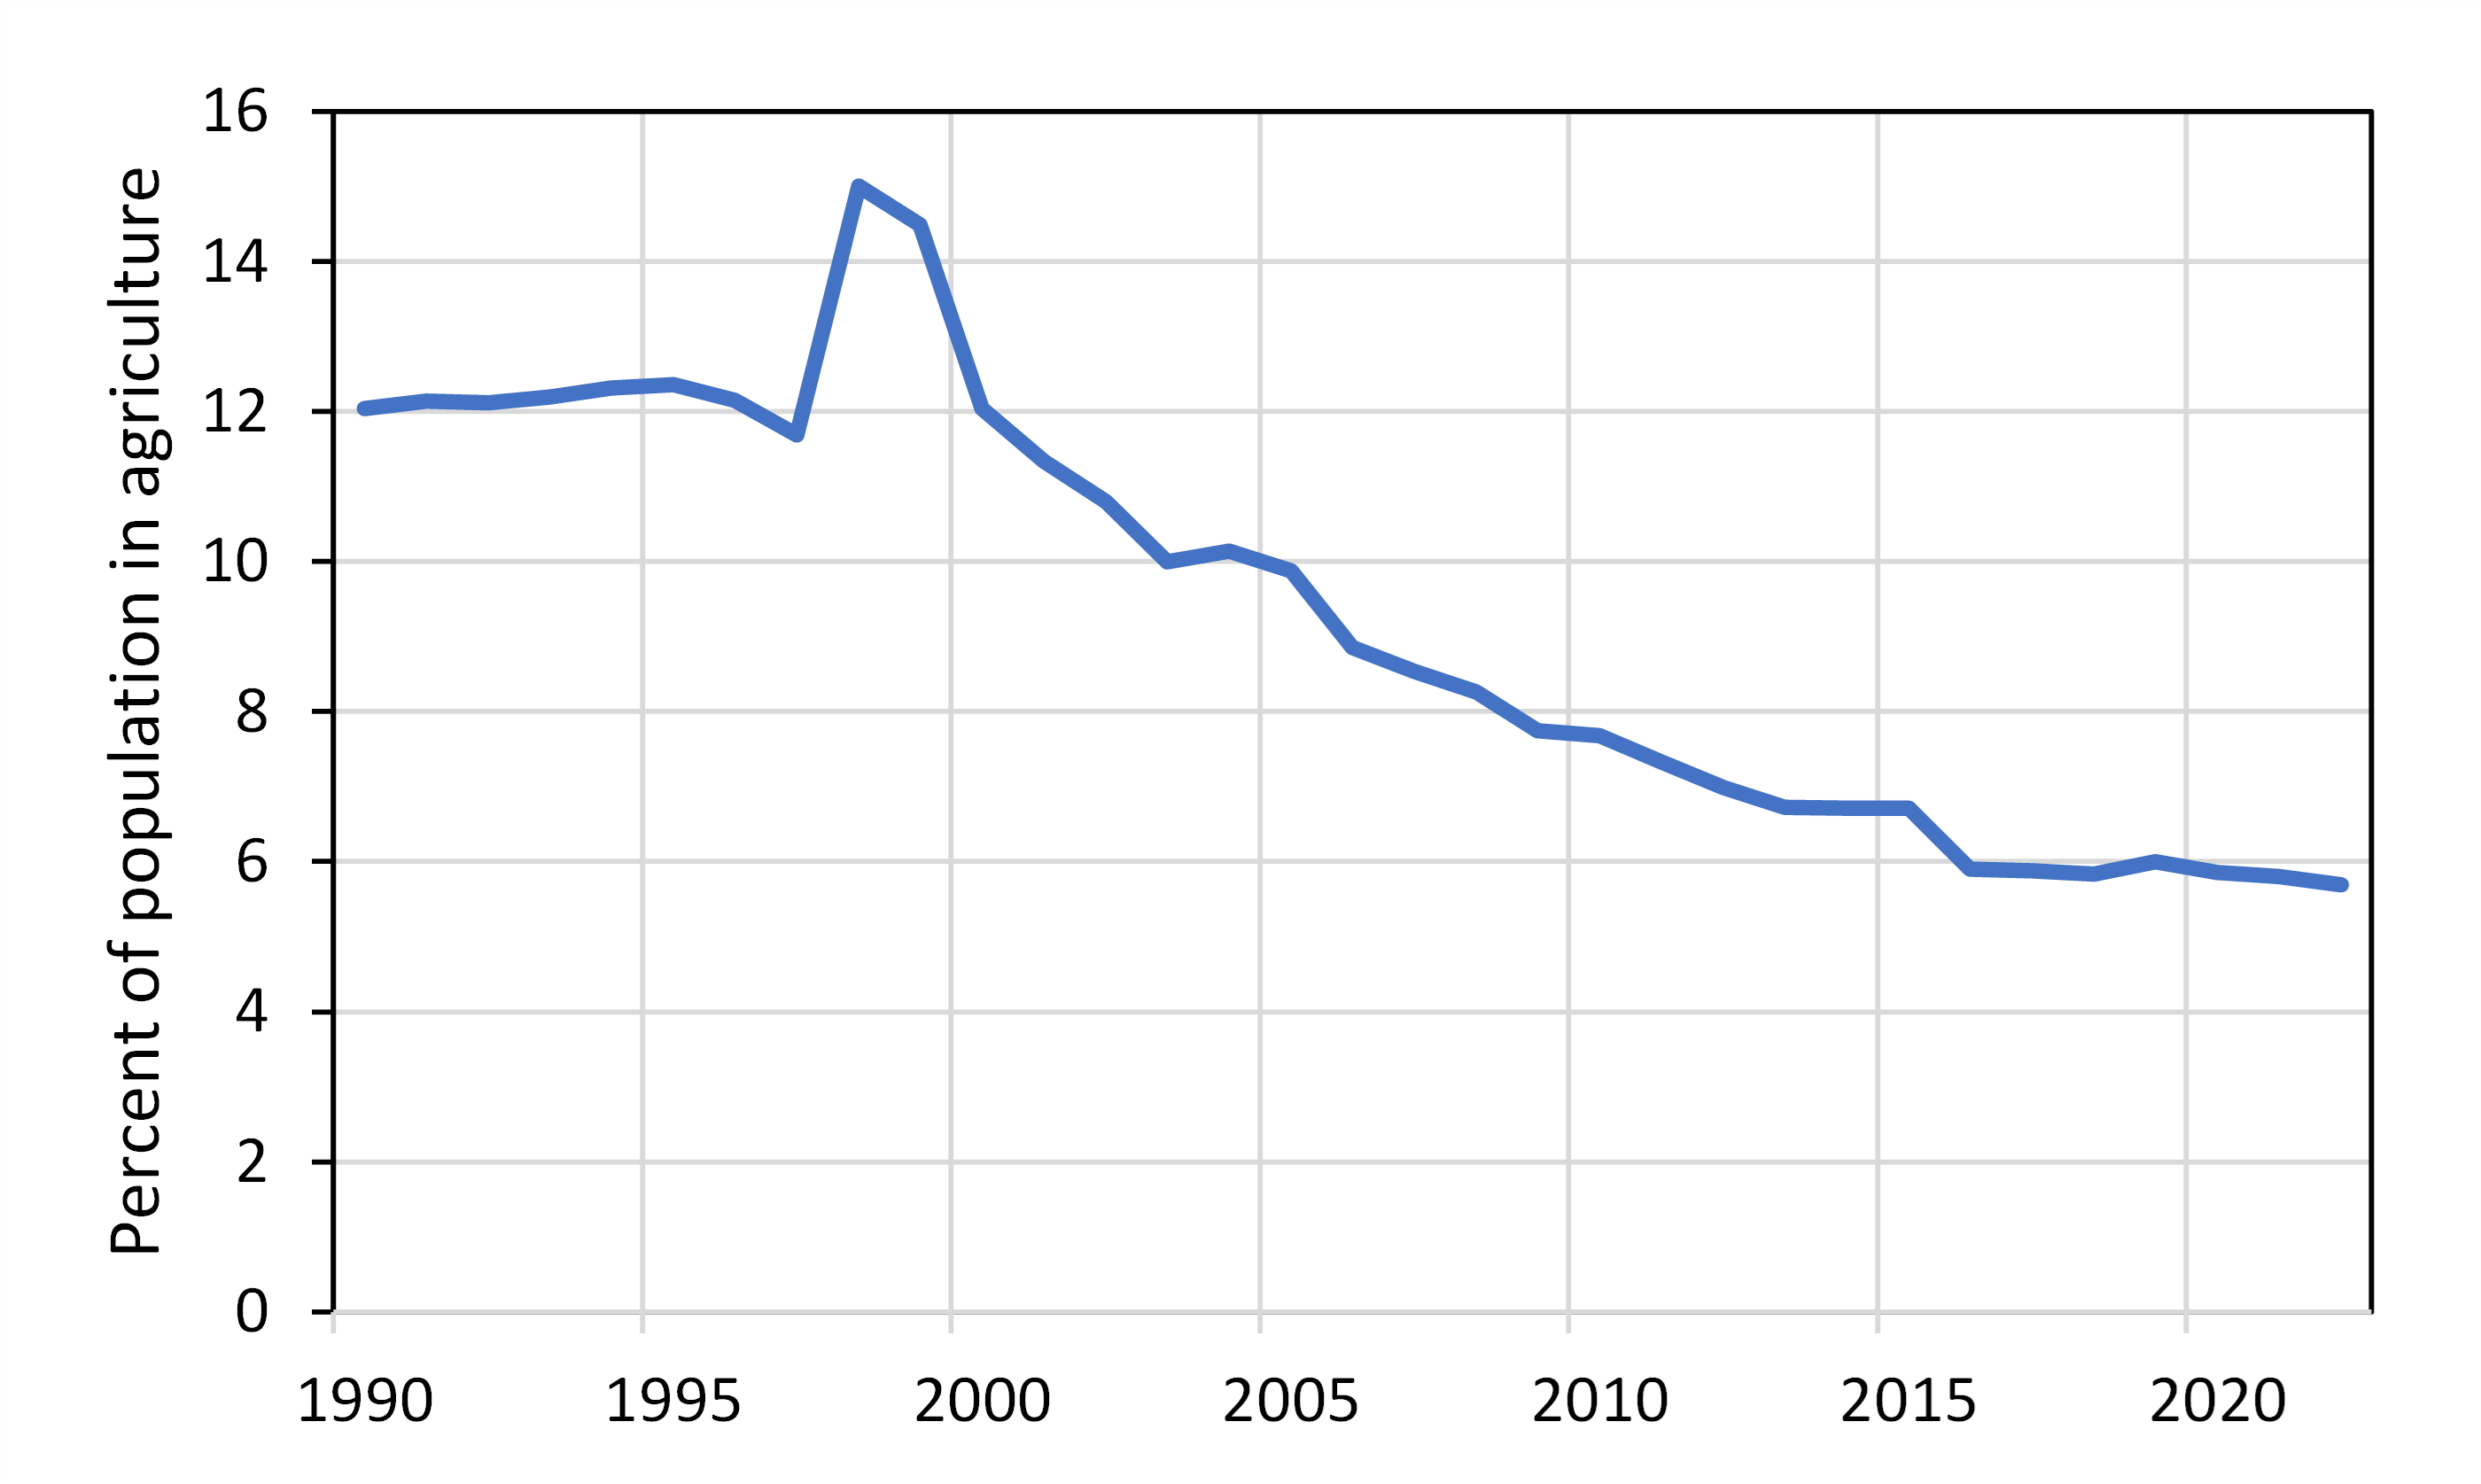
- Russian population is currently ~143 million and has been declining from a peak of 148.5 million in 1992 (Fig. 2). Employment in agriculture decreased from ~12% in the early 1990s to 6% in recent years (Fig. 3).
- Russian trade in 2022 totaled $479 billion, dominated by fossil fuels (70%) with agricultural products ~6% (~$27 billion). Ukraine trade in 2022 totaled $38.5 billion, dominated by agricultural products ($25.7 billion, 67%). (Resource Trade Data)
- The history of the Soviet Union is strongly linked to agriculture. The Soviet Union was formed on Dec. 30, 1922.
- The Bolshevik or October Revolution occurred in 1917, when Vladimir Lenin overthrew Russia’s Provisional Government, establishing the world’s first communist state and creating a republic. “Collective farming” or kolkhoz began at this time. Many Ukrainians tried to preserve private property. Collective farming was like “collective irresponsibility” because the farms were ineffective and nobody cared.
- Ukraine was always famous for its fertile soils (black chernozem with high levels of humus). During World War II, the Nazis cut much of the productive lands, shipping the soil back to Europe. About 70% of Ukraine is arable land.
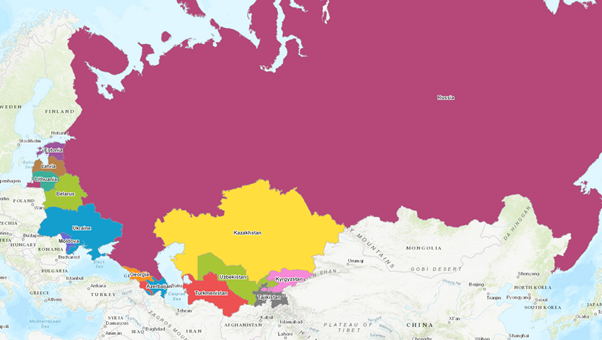
- The collapse of the Soviet Union (Dec. 26, 1991) resulted in 15 independent countries (Fig. 4). Small holder farms were re-established in many areas. In Georgia, Corona satellite data show large collective farms in 1971 (Fig. 5) that later transitioned to small fields.
- The Soviet Union collapse led to widespread cropland abandonment, estimated to be ~87 Mha (0.87 million km2) in European Russia, Ukraine, and Belarus combined (Shierhorn et al., Glob. Biogeochm. Cycles, 2013).
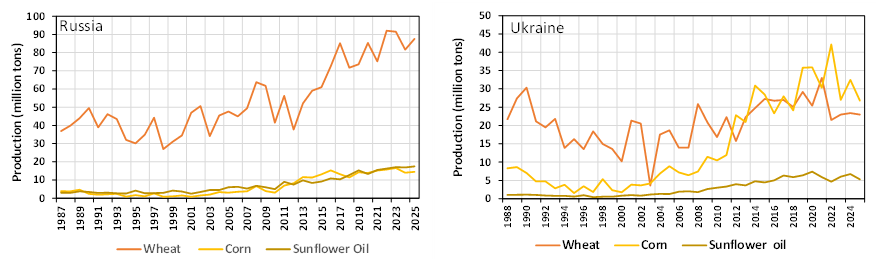
- Wheat production remained stable or declined in the 1990s but then increased within the last decade since ~2012–2013 in Russia and the Ukraine (Fig. 6).
- Russia is the largest exporter of wheat globally, mostly exporting to the Middle East, African countries. Russia accounted for ~20-23% of global wheat exports in 2017–2018 (Abys et al., ERC, 2022). Ukraine is also a major exporter of wheat, accounting for 10% of global exports prior to the Russian invasion (Feb. 24, 2022). Ukraine exports wheat to Northern Africa and other countries.
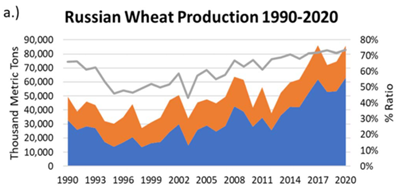
- The ratio of winter wheat to total wheat production has been increasing in Russia since the mid 2000s (Fig. 7).
- During the Soviet Union collapse, winter wheat production in Russia and Ukraine averaged 2 tons/ha. Now it is up to 4 tons/ha. However, spring wheat production did not change much.
- Winter wheat production is 2–4 times as high as spring wheat.
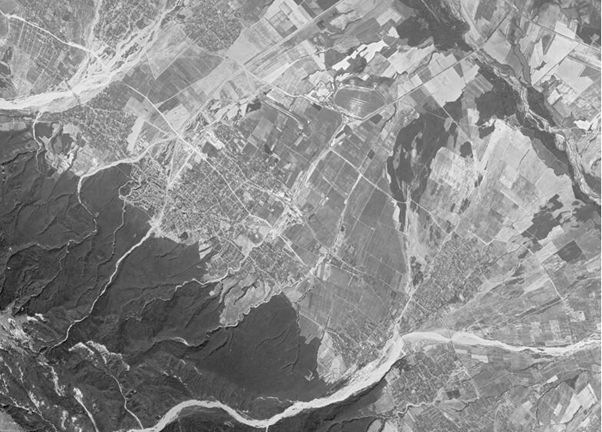
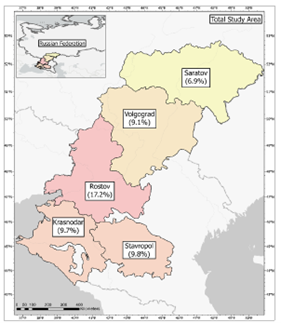
- Winter wheat has been mostly produced in southern Russia (major oblasts include Stavropol, Krasnodar, and Rostov) (Fig. 8). Spring wheat is grown mostly in northern Russia. Winter wheat dominates production in Ukraine.
- Wheat exports have been impacted by droughts and conflict (e.g., Russian invasion of Ukraine, etc.).
- The 1990s were a very difficult time for Ukraine and neighboring countries. Before the annexation of Crimea, Ukraine had a goal of joining the European Union. However, the largest political group in the region was still the Communist party. They did not join NATO and the EU like the Baltic countries.
- Winter wheat phenology includes planting in Sept., dormant during the winter. Snow cover helps protect winter wheat against freezing temperatures and also increases soil moisture, raising protein levels. Most winter wheat in Russia is exported, representing ~$10 billion dollars annually (e.g., $11 billion in 2023).
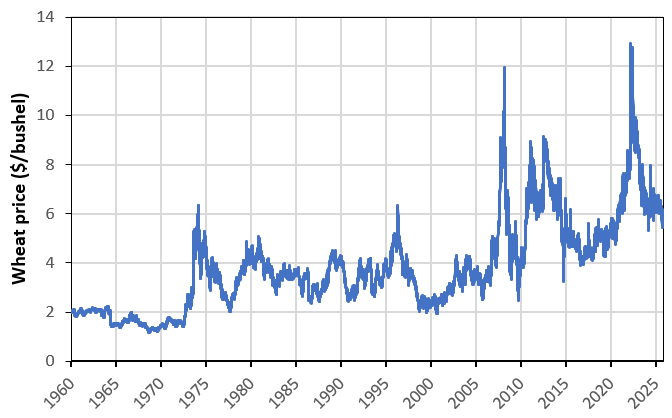
- Wheat prices have been highly variable over time (Fig. 9).
- Spring wheat prices are lower and it is mostly used for internal consumption.
- Winter wheat production increased from 2–4 tons/ha after collapse of Soviet Union, better machinery and better seeds.
- Sunflower and grapes are more profitable than wheat.
- The governments partially dictate what crops are grown for food security but it is unclear how much they control in a more market driven economy.
- When Medvedev was president in Ukraine, there was an emphasis on increasing wheat production.
- Sunflower crop has always been important in Ukraine for sunflower oil used for cooking and dressing. It is highly profitable for farmers (Fig. 6).
- Sunflower is very demanding on the soil and is grown once every seven years.
Monitoring Grain Production using Satellite Data
- USDA Foreign Agricultural Service used to conduct field campaigns in Russia and Ukraine but these are no longer feasible (ended in Feb. 2022).
- We rely on satellite data to monitor crop production. The Large Area Crop Inventory Experiment (LACIE) was a joint U.S. program, involving NASA, USDA, and NOAA, that began in the 1970s to monitor global wheat production focusing intensively in the Soviet Union (link). The program was initiated after the Great Grain Robbery where USSR purchased large amounts of U.S. wheat at a discount, impacting the global market (link).
- NASA GEOGLAM (Group on Earth Observations Global Agricultural Monitoring) was formed at this time (geoglam.org).
- Agricultural market information is also collated because many food-insecure countries in Africa rely on imports from Ukraine and Russia and can lead to famine.
- GEOGLAM relies on satellite data because it is repeatable and consistent and can provide information on crop types, where they are growing, and estimate production.
- Qadir et al. (Sci. of Rem. Sens., 2024) used Sentinel 1 Synthetic Aperture Radar (SAR) to monitor sunflower phenology, observing help-optic behavior, movement of sunflowers toward the sun. This model helped map sunflower production after the invasion, indicating that production did not decline as much as initially thought from the invasion.
- Skakun and his team work with Ukrainian ministry or statistical agencies to provide data on crop production in areas occupied by Russians also. They cannot determine where the funds from grain production go? (billions of dollars), likely the black market?
- MODIS satellites used to monitor crop production: MODIS installed on Terra (am) and Aqua (pm) satellites resulting in two observations per day. They were launched in 2000 and are still operating.
- MODIS spatial resolution 500 to 1000 m, suitable for large fields in Ukraine and Russia.
- Applied change detection to MODIS data from 2000 – 2004 to 2017 – 2020, 250 m resolution.
- Photo interpretation used to help with identifying winter crops.
- Matt Hanson at Univ. MD did global crop mapping using Landsat but it was difficult before the Sentinels became available in 2015-2016.
- Evolution of remote sensing: NASA Harvest, early on a single satellite (Landsat), later harmonizing Landsat and Sentinel, increase spatial and temporal resolution. Applying machine learning to harmonize data.
- Combining multiple satellites:
a) MODIS 500-1000 m spatial resolution;
b) Landat 9, 8-day revisit cycle, 30 m resolution;
c) Sentinel 2 (A, B, C) 2-3 day revisit time - Winter crop mapping: need good signal in early spring but it is usually cloudy, problem for Landsat.
- Sentinel 1 (Synthetic Aperture Radar) penetrates clouds.
- Sentinel 1 D launched recently provided by European Space Agency.
- NASA: harmonized Landsat and Sentinel 2 product.
- Commercial satellites are also available: Planet Labs (3 m resolution, daily)
- AI/ML: foundation models, training data precomputed features.
- Recent research: satellite-based maps on error estimation.
Climate Extremes and Climate Change Impacts on Cereal Production in Russia and Ukraine
- Extensive drought in 2010 reduced wheat production by 70% in top producing oblasts and total wheat production loss of 20 million metric tons (Hunt et al., Weather & Climate Extremes, 2021). Wheat production was also greatly reduced in Ukraine and Kazakhstan.
- In 2010 they put an export ban on wheat and the price markedly increased by ~2× in a few months.
- Research indicates that intensification accounts for 33% increase in winter wheat production in S Russia and expansion accounts for for 66% increase in N Russia (Abys et al., RSA: Soc & Env., 2024).
- Southern regions may experience a reduction in yield with rising temperatures in the future reduced snow cover may not protect winter wheat from freezes but increased fertilizer applications may compensate.
- Rise in temperature to the north should increase yield because of longer growing season. They may convert from spring wheat to winter wheat.
- It is difficult to distinguish winter wheat from oats and barley using remote sensing.
- Soil productivity may constrain northward expansion of winter crops. Soil data are limited and old.
- Intensification of crop production accounted for about a third of increase in production and expansion accounted for two thirds.
- Russia has more potential for northward expansion of crops relative to Canada.
- Managing soils is also important: lot of emphasis on no-till agriculture in the U.S. but not in Russia or Ukraine.
- Russia currently focusing on military issues. Can they find enough people to increase crop production and investment in this area?
- Russia may use a potential grain export ban as leverage for food insecure countries.
- Many African countries depend on grain imports from Russia and Ukraine: Africa, Kenya, and Egypt, and Mozambique. A report from 2022 indicated that 40% of the World Food Program’s wheat was derived from Ukraine (link).
- Skakun’s research indicates that wheat production could increase 50-70% more in the future.