Listen here on Spotify | Listen here on Apple Podcast
Episode released on May 7, 2026
Episode recorded on March 11, 2026
 Huilin Gao discusses advances in reservoir monitoring using models and new remote sensing, providing daily evaporation rates for Texas, western U.S., and global scales.
Huilin Gao is a Professor in the Department of Civil & Environmental Engineering at Texas A&M University. She is a Fellow of the American Meteorological Society. Her research focuses on reservoir monitoring using remote sensing at local to global scales.
Highlights | Transcript
1. Texas Water & Reservoir Context
a. Texas Water Use
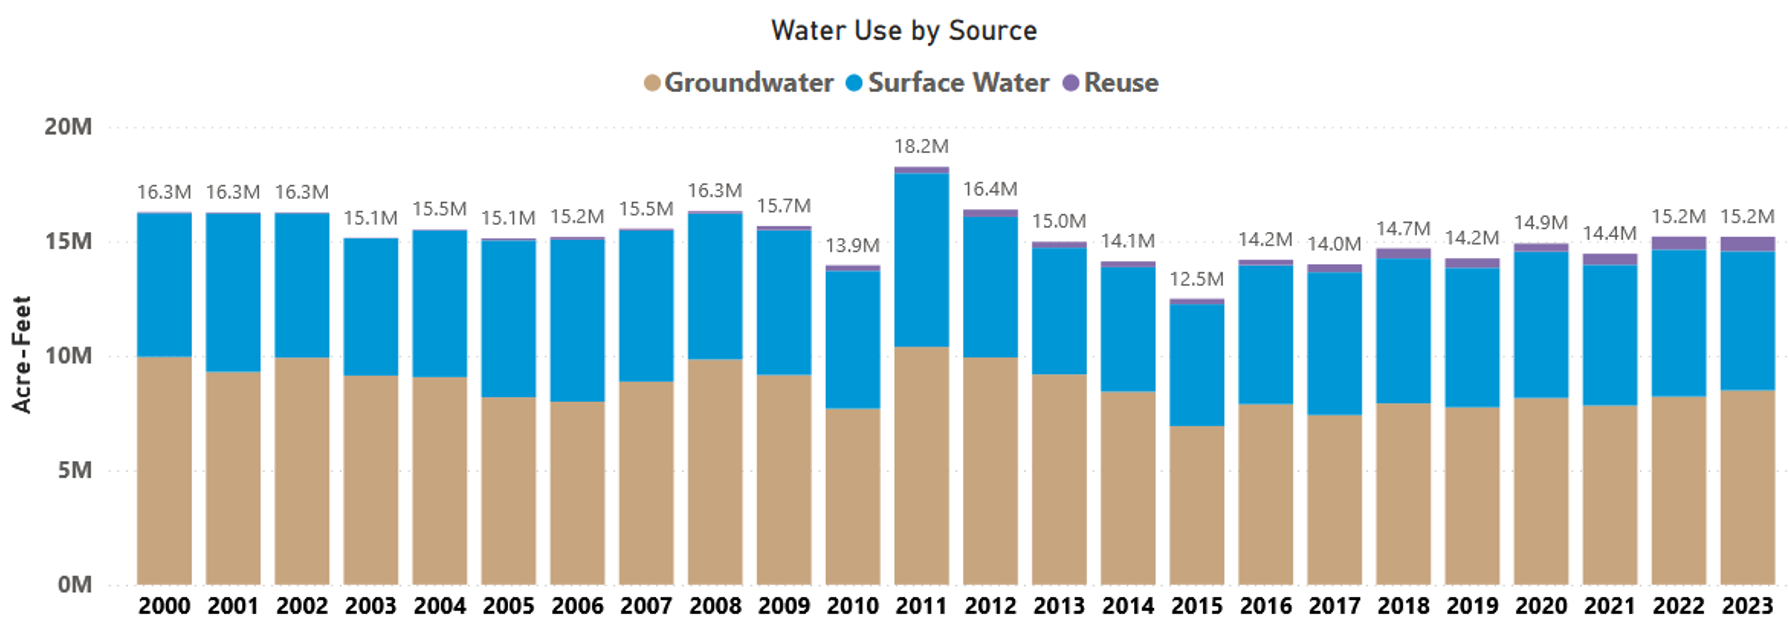
- ~40% of Texas water use (~6 million acre-feet) comes from surface water (2023) (Fig. 1).
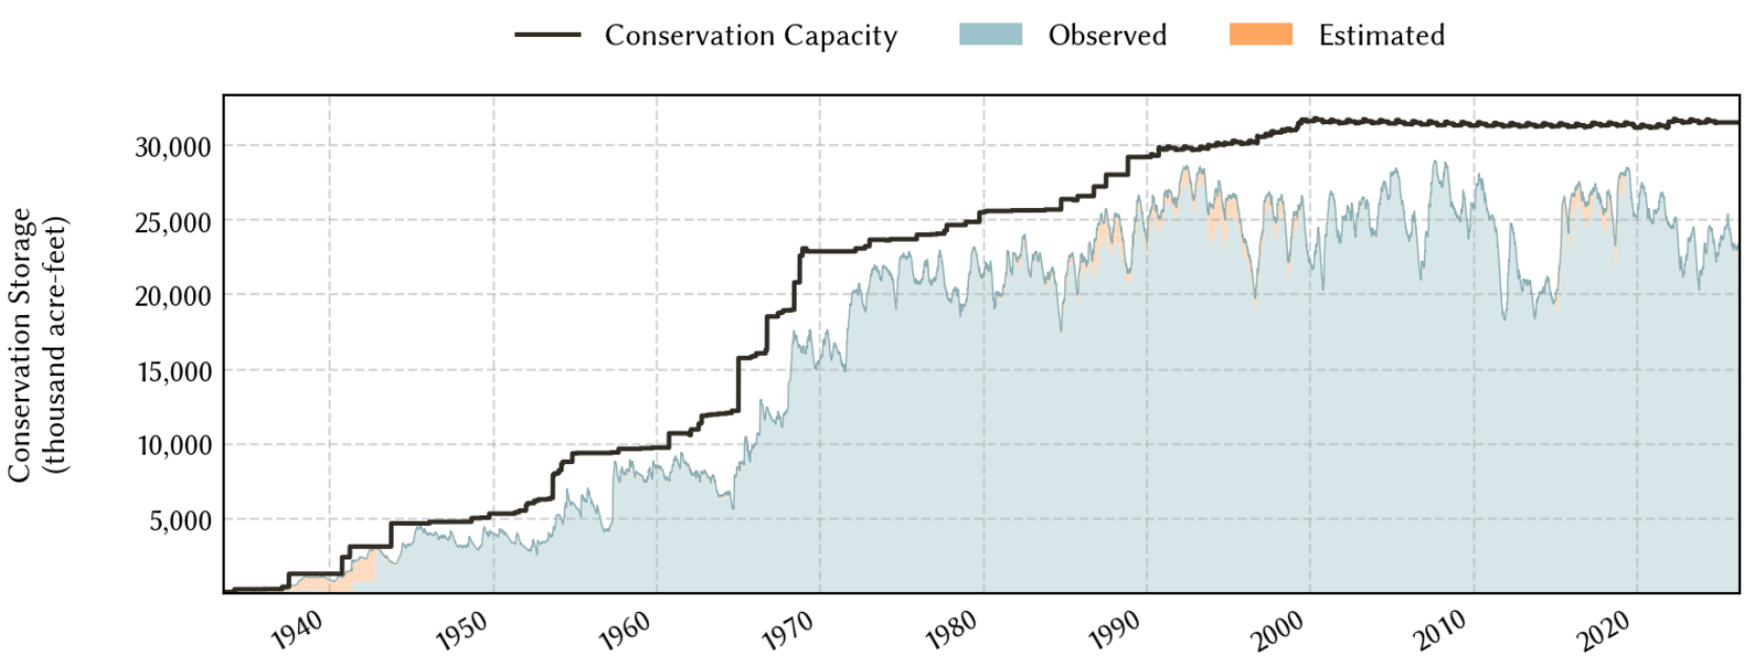
- Total water use ~15.2 million acre-feet (18.7 km3); reservoir conservation capacity totaled ~31.5 million acre-feet (39 km3; Fig. 2).
- Texas has:
- Only one natural lake (Caddo Lake).
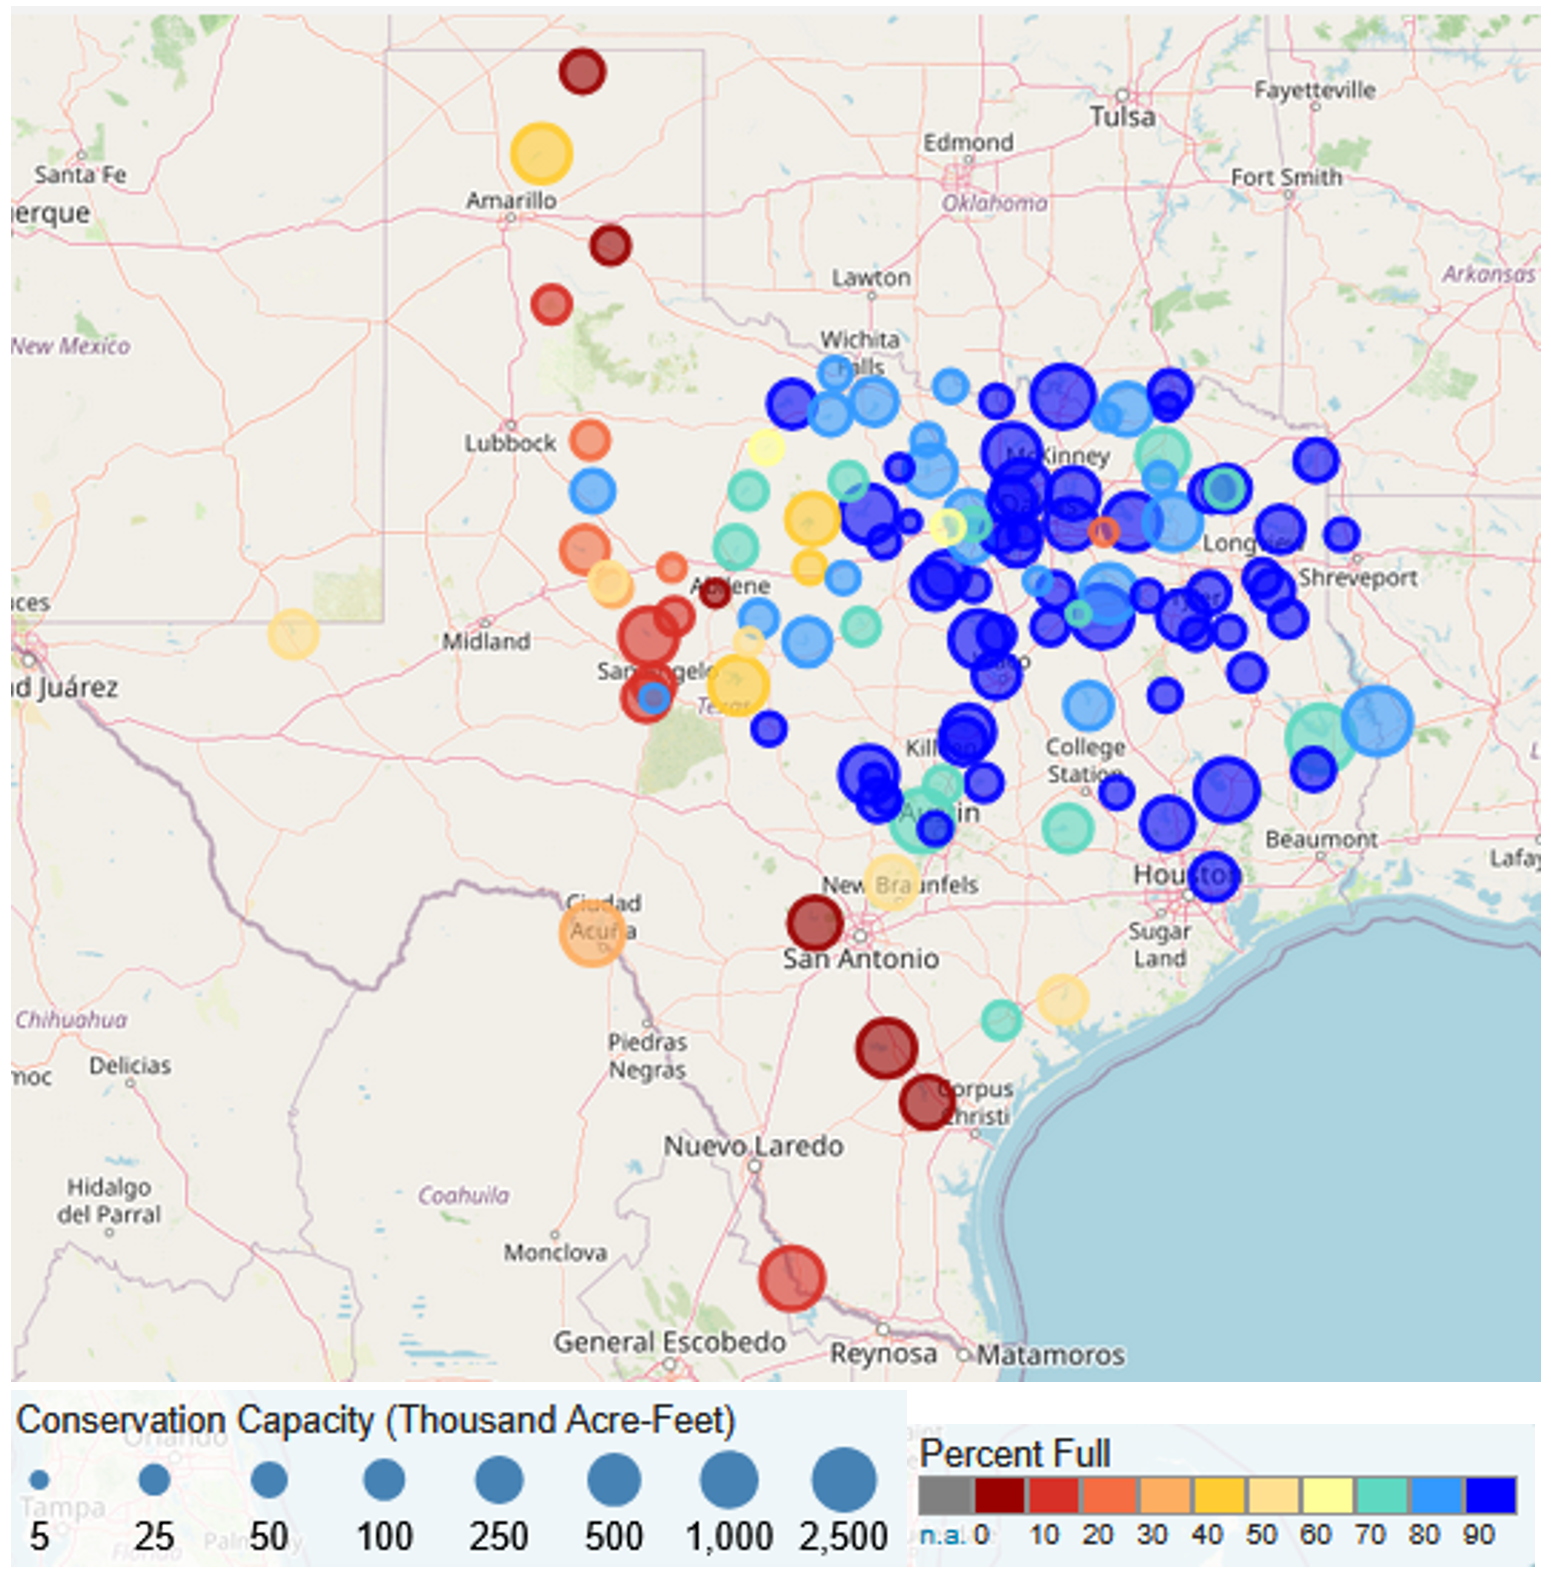
- 7,000 dams and ~189 major reservoirs (Fig. 3).
- Reservoirs are mostly in eastern Texas due to precipitation gradient.
b. Variability in Reservoir Storage in Texas
- Strong seasonal variation:
- Spring & fall = recharge
- Summer = high evaporation losses
- Significant interannual variability:
- 2011 drought → severe statewide storage decline
- 2015 floods → recovery
- Regional disparities:
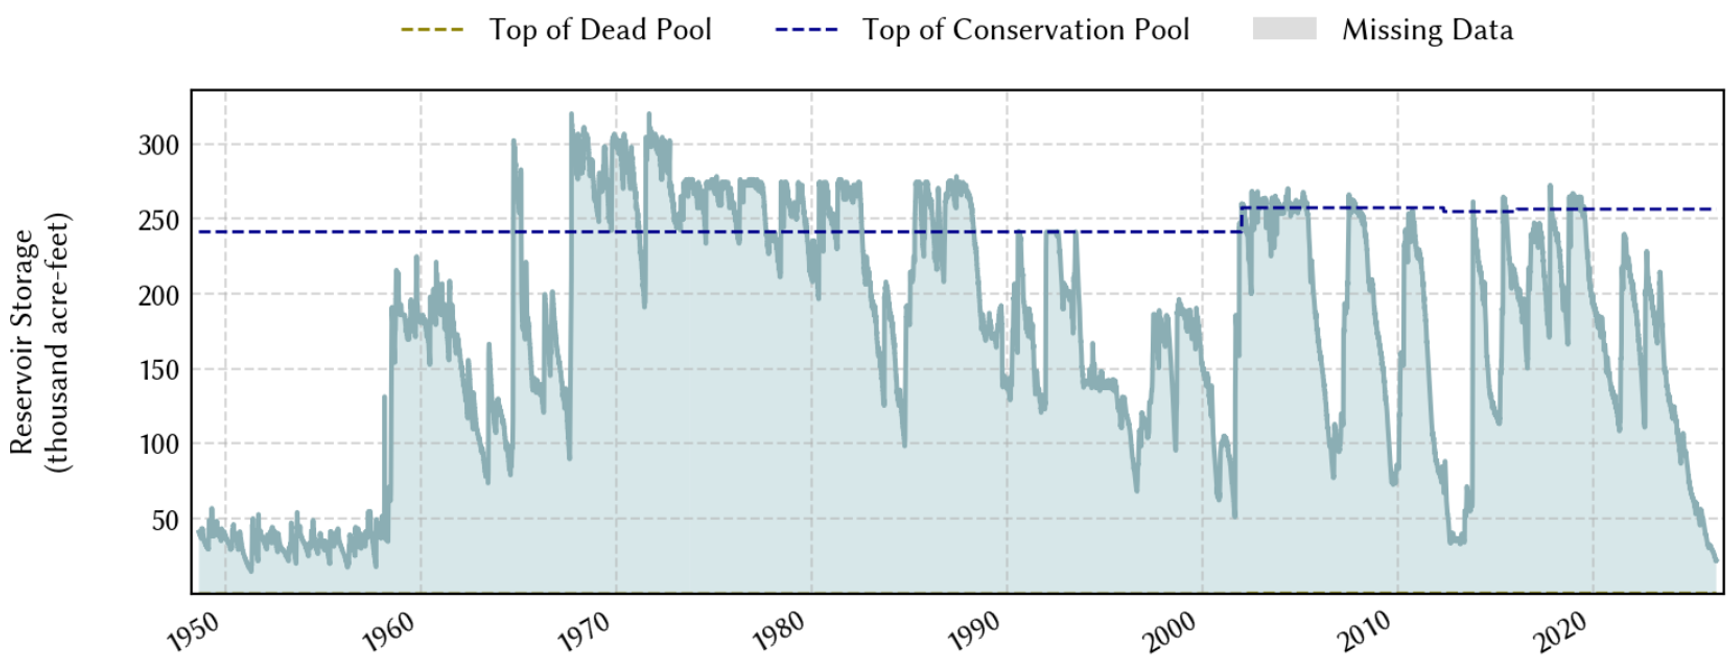
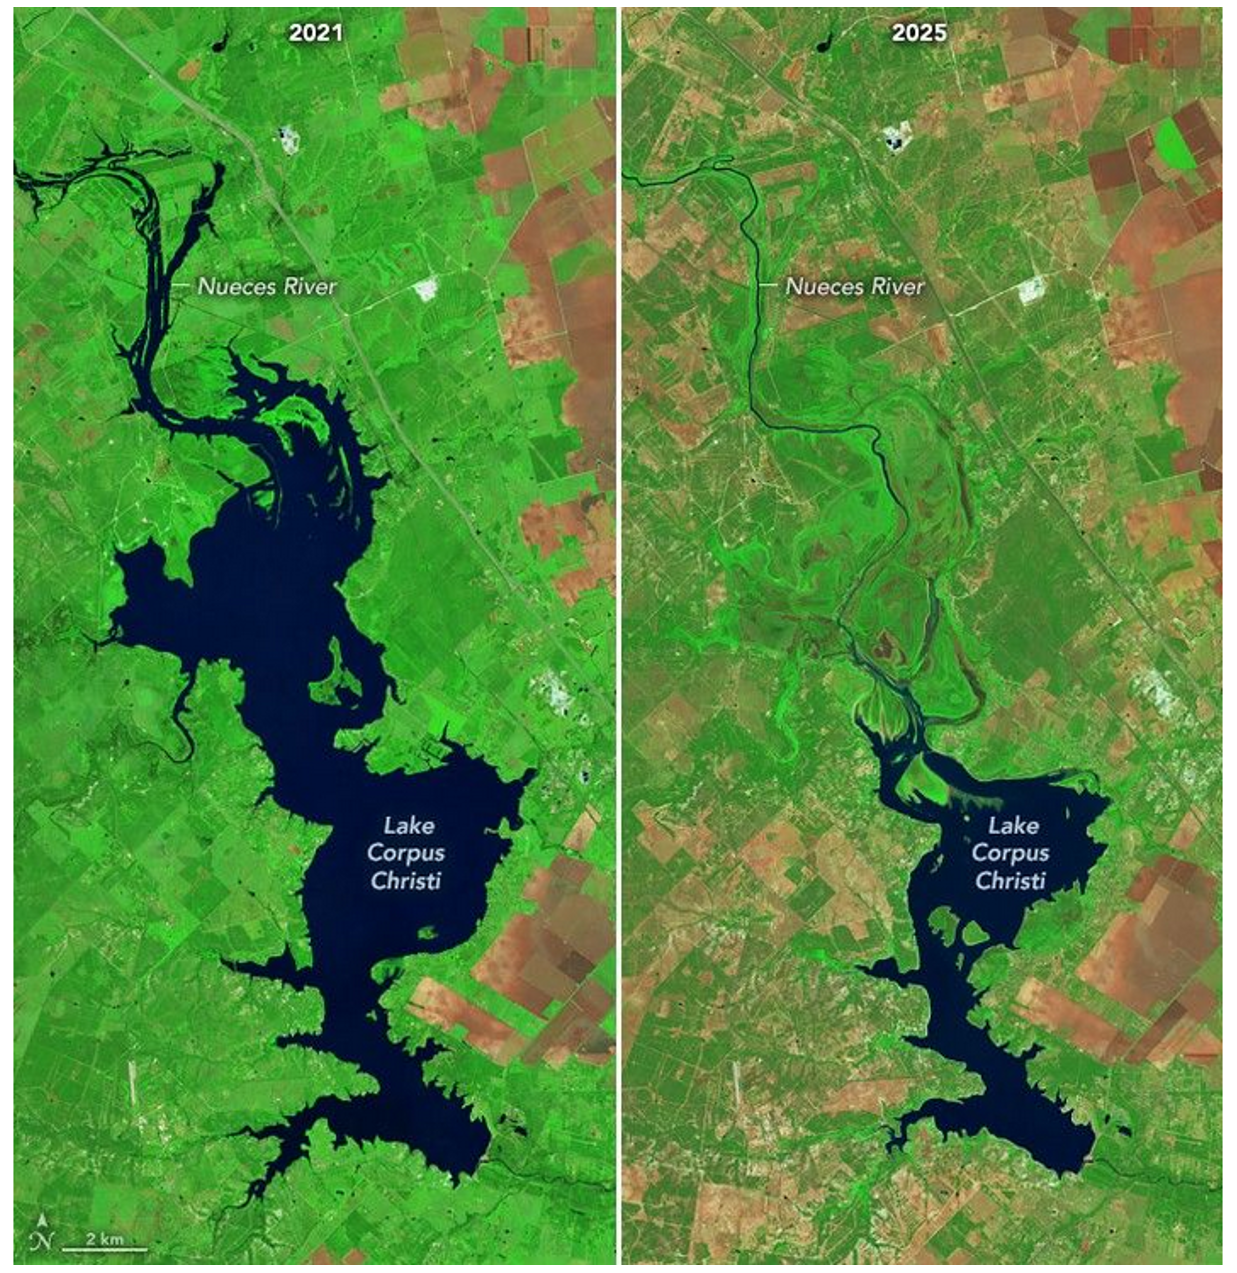
- Some areas (e.g., Corpus Christi) currently experiencing severe low storage (Fig. 4; Fig. 5).
c. Importance of Reservoir Evaporation in Texas
- Annual evaporation loss in Texas ≈ 2.4 million acre-feet (~15% of total water use).
- Evaporation increases during drought (less precipitation + higher temperatures).
- Key drivers:
- Shortwave radiation
- Temperature
- Vapor pressure deficit (dry air)
- Wind speed
- Reservoir size & depth
- Shallow, large-surface reservoirs lose more water.
d. Drought Dynamics
- Types of drought:
- Meteorological (low rainfall)
- Agricultural (soil moisture deficit)
- Hydrological (low reservoir storage)
- Drought impacts:
- Reduced inflows (more infiltration, less runoff)
- Increased evaporation due to heat
- Increased human demand and environmental flow requirements
- Multi-year droughts are especially damaging.
2. Methods of Estimating Reservoir Evaporation
a. Limitations of Traditional Methods
- Evaporation pans:
- Simple and long-term data record
- Poor representation of real reservoirs because cannot represent reservoir area or depth
- Sparse coverage (~1 per 3,280 sq miles in Texas)
- Monthly evaporation estimates
- Use of fixed coefficients introduces bias
b. Improved Evaporation Modeling
- Daily Lake Evaporation Model (DLEM; Zhao et al., WRR, 2024) based on Penman equation (physics-based):
- Combines energy balance + aerodynamic components
- Readily available gridded meteorological data for input
- Key improvements:
- Inclusion of heat storage (important for large/deep reservoirs)
- Inclusion of wind fetch effects
- Enables:
- Daily evaporation estimates
- Reservoir-specific calculations
- Reservoir evaporation from Penman equation validated against Eddy Covariance data (most accurate but expensive to monitor)
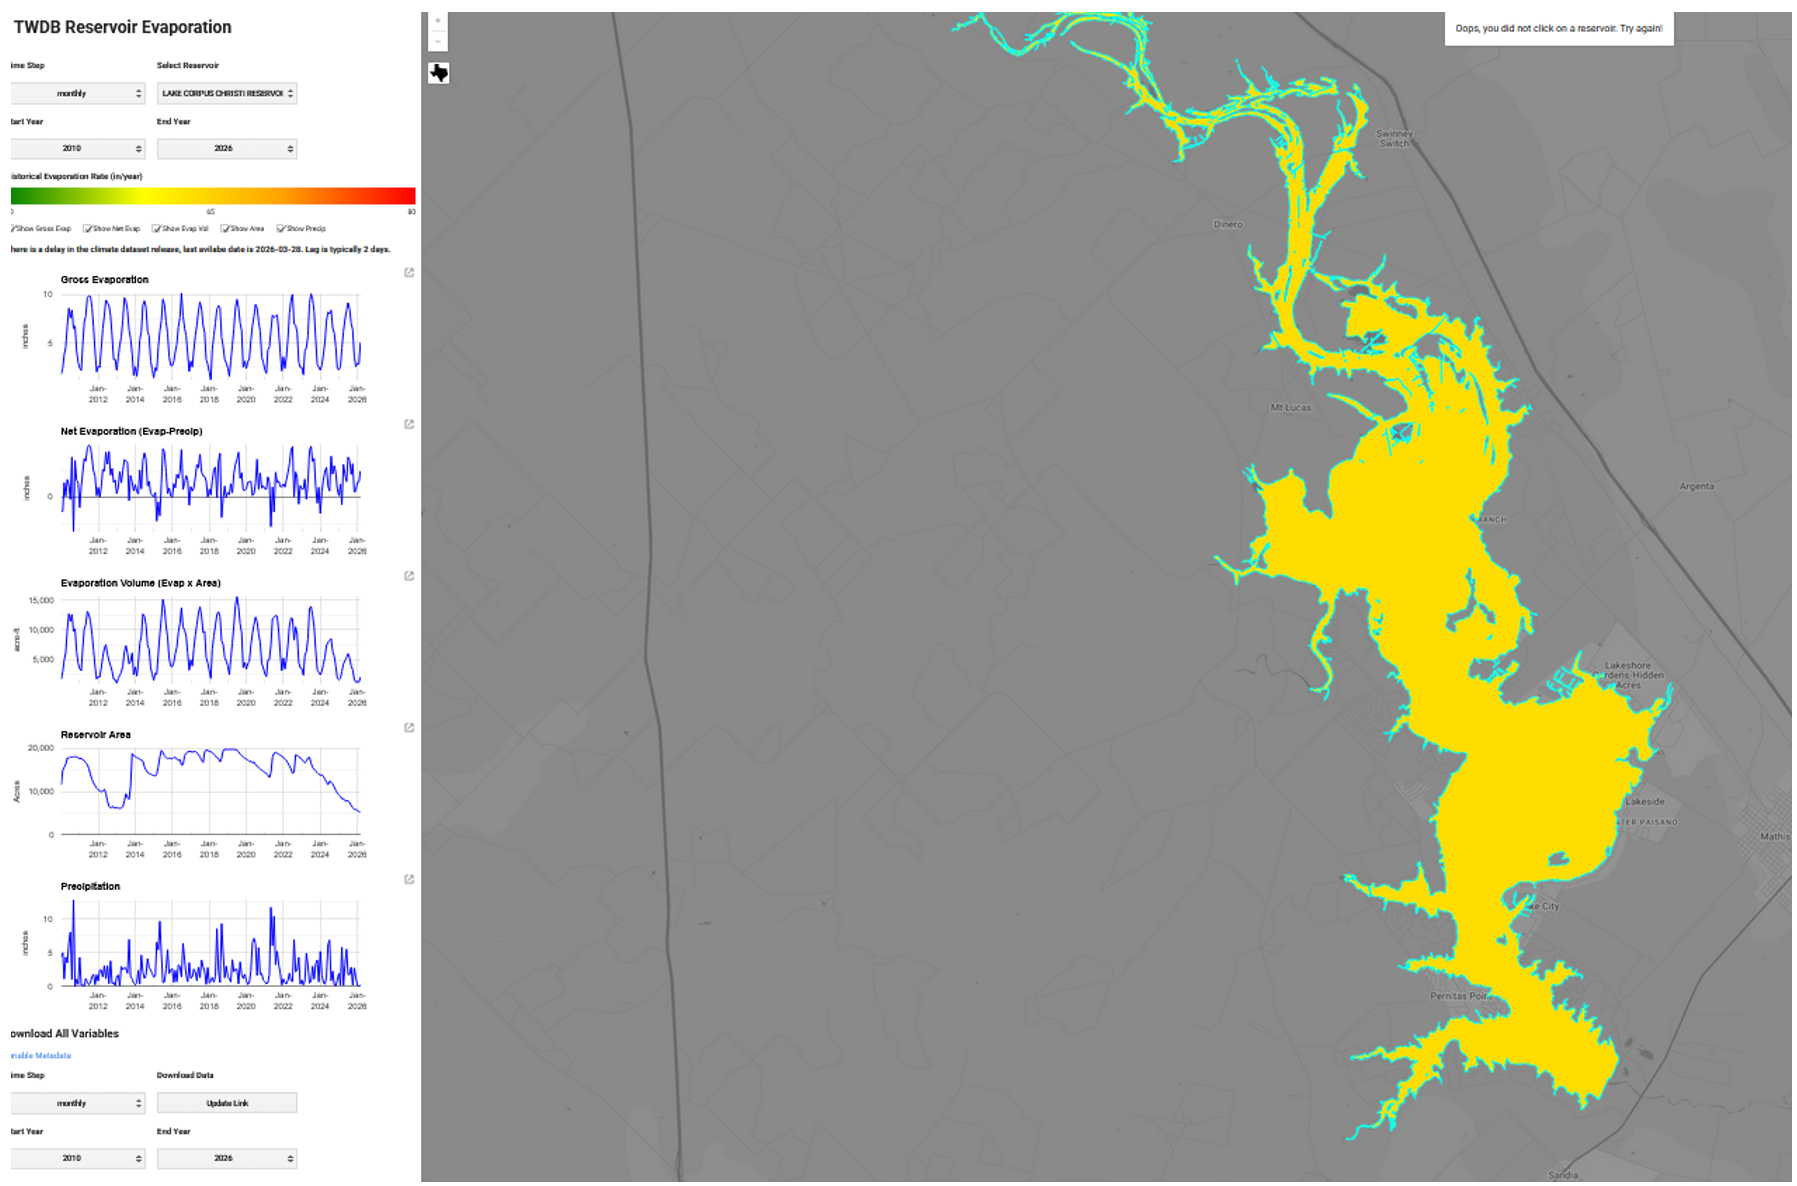
c. Texas Reservoir Daily Lake Evaporation Monitor
- Covers 189 reservoirs (1980–present, ~2-day latency (Zhao et al., WRR, 2024) (Fig. 6)
- Provides:
- Evaporation rate (gross & net)
- Precipitation
- Surface area (where available)
- Evaporation volume
- Meteorological forcings: Real Time Mesoscale Analysis (RTMA) data set, 2.5 km; GridMET, 4 km daily data
- Accessible with daily, monthly, annual outputs.
- Highest evaporation recorded on Sep. 5, 2011
- Evaporation trend 0.076 mm/d/decade attributed to changes in shortwave radiation primarily (brightening)
- Seasonal variation in evaporation: low in winter and highest in summer (July, 6.9 mm/d).
d. Applications for Water Management
- Used by:
- Texas Water Development Board (TWDB): Water Availability Models (WAM), estimating firm yield (reliable supply during worst drought)
- Lower Colorado River Authority (LCRA), Reservoir operations and flood control
- U.S. Army Corps of Engineers DFW office, daily reservoir inflow estimation
- Evaporation trends increasing (~48 → 52 inches/year in 40 years).
3. Remote Sensing Advances
a. Use of satellites (Landsat, Sentinel, SWOT [Surface Water and Ocean Topography]) to estimate:
- Reservoir area, elevation/depth
- Storage
- Overcomes lack of in-situ data
- Enables national/global datasets
b. U.S. and Global Findings
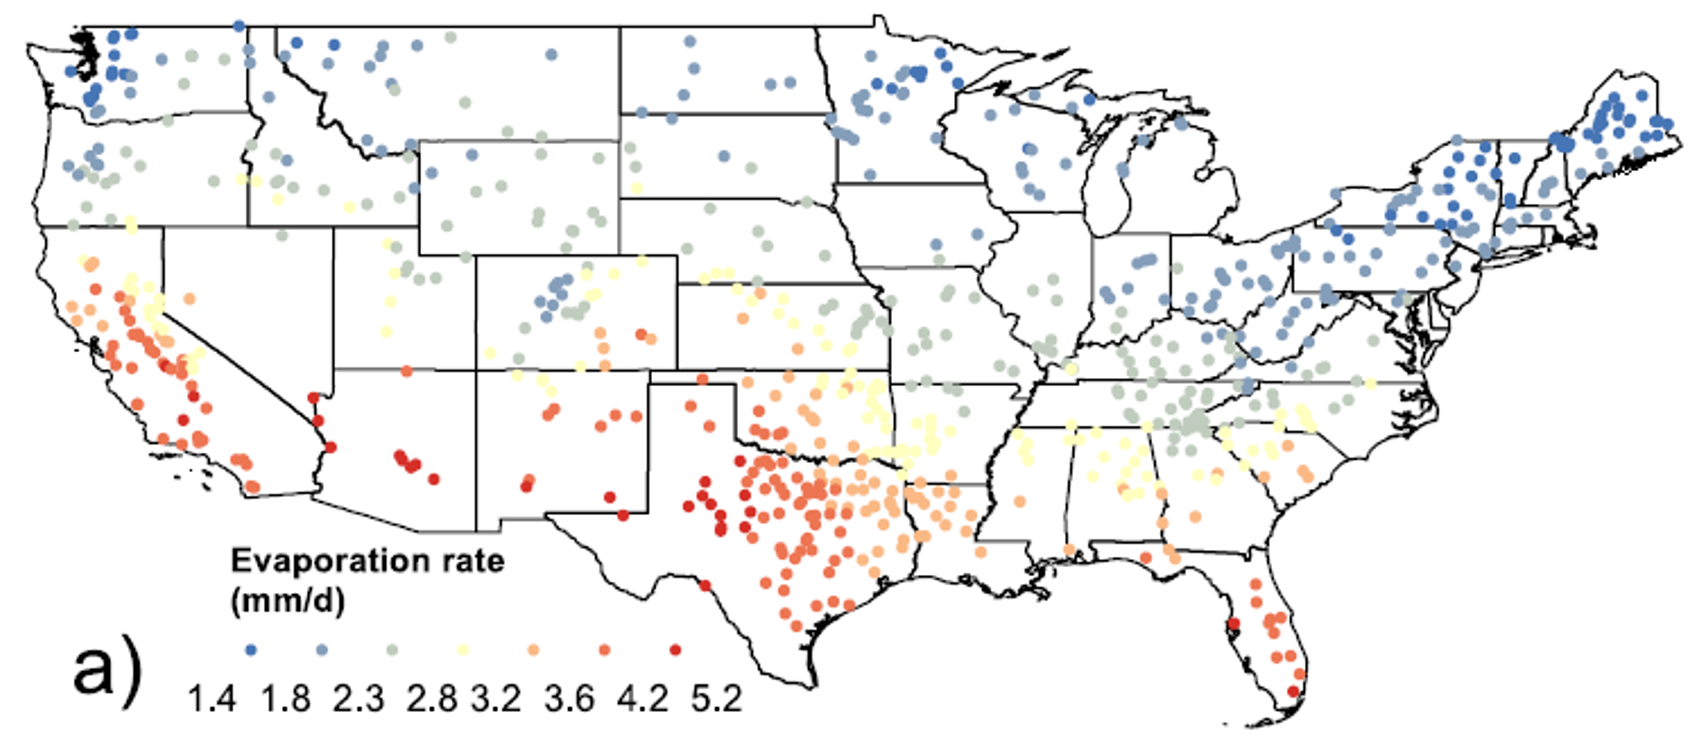
- U.S. reservoir evaporation ≈ 34 km³/year (1984–2015) (Zhao and Gao, RSE, 2019) (Fig. 7)
- Reservoir surface area: Global Reservoir Surface Area Dataset (GRSAD) from Landsat (Zhao and Gao, GRL, 2018)
- Evaporation rate: Lake Evaporation Model (LEM) based on Penman Equation
- Reservoir evaporation = 93% of Public Water Supply
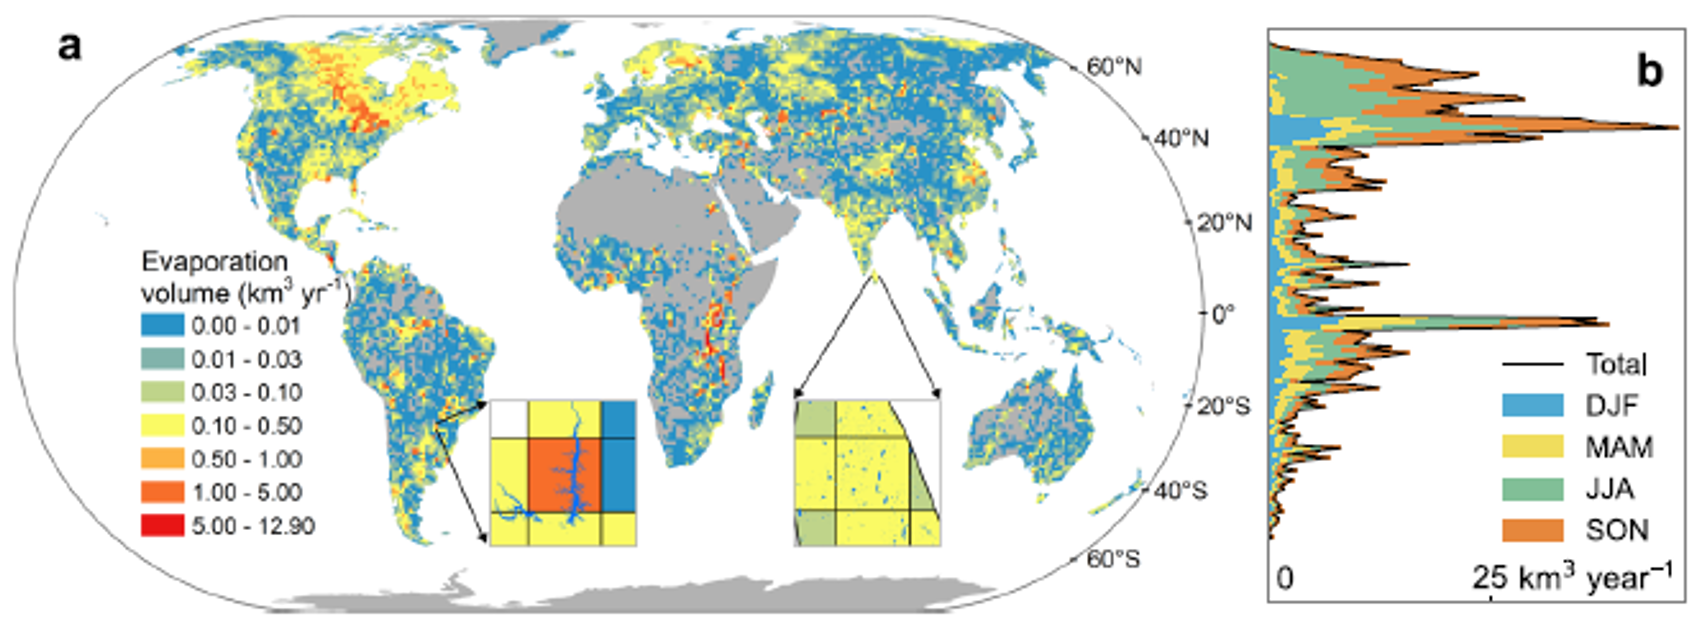
- Global lake/reservoir evaporation (Zhao et al., Nature Comm., 2022):
- Gridded annual evaporation volume varies globally (Fig. 8)
- 1.42 million lakes, 1985–2018; ~1500 km³/year total
- Lake evaporation rate increasing at rate of 3.1 km3/yr
- Trend attributed to ↑ evaporation rate (58%), ↓ lake ice cover (23%) and ↑ lake surface area (19%)
- Reservoirs = 5% of storage but 16% of evaporation
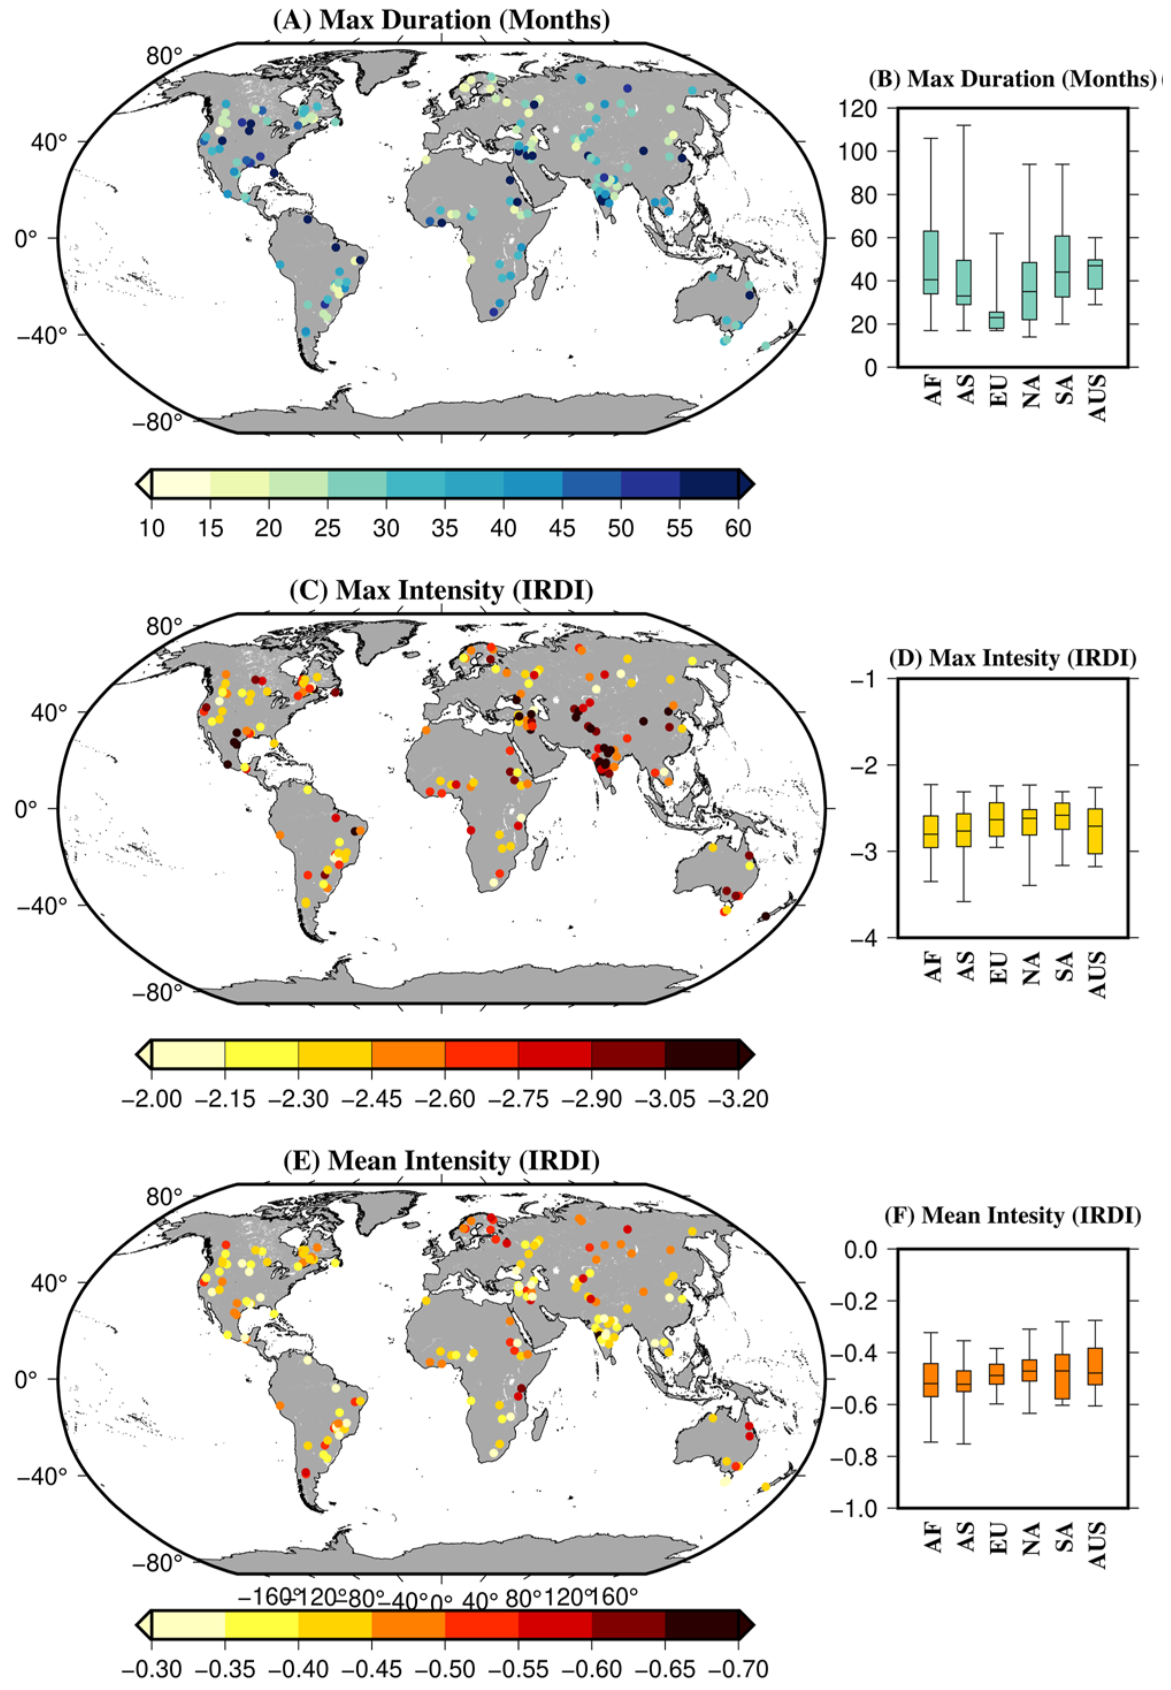
4. Reservoir Drought Index
- Developed Integrated Reservoir Drought Index (IRDI) (Shah et al., GRL, 2024) (Fig. 9)
- Combines:
- Reservoir storage anomalies (164 global reservoirs)
- Evaporation (faster response signal)
- Improves early warning of drought conditions.