Listen here on Spotify | Listen here on Apple Podcast
Episode released on February 26, 2026
Episode recorded on January 29, 2026
 Manoochehr (Manoo) Shirzaei discusses land subsidence in many regions globally, including Iran, California, Arizona, and U.S. coast based on satellite data.
Manoo Shirzaei is an Associate Professor of geophysics and remote sensing at Virginia Tech.
Highlights | Transcript
Land Subsidence in Iran
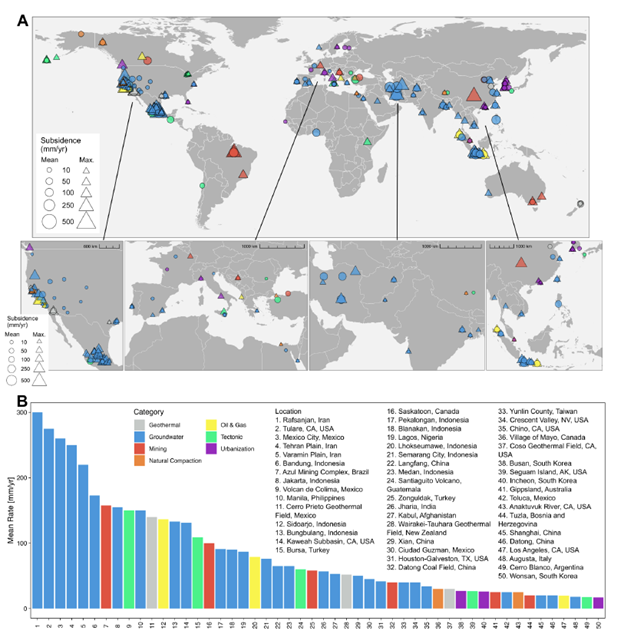
- Land subsidence is a critical issue in many regions globally and advances in satellite remote sensing and AI/ML to process satellite data more readily have revolutionized global monitoring of land subsidence (Fig. 1).
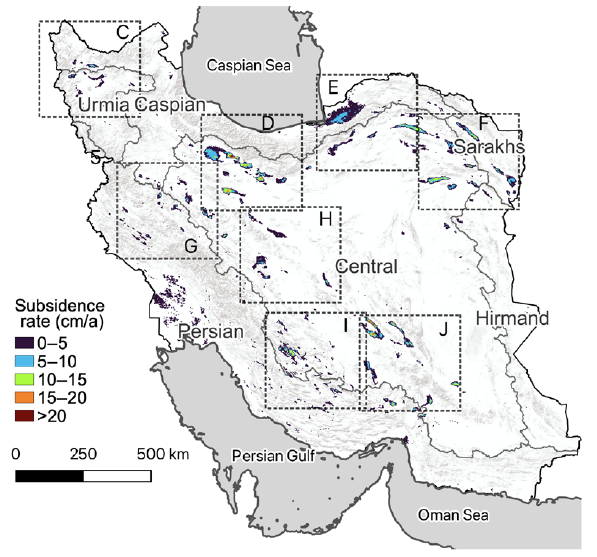
- Iran is a global hotspot for land subsidence, driven primarily by chronic groundwater over-extraction compounded by climate variability and weak water governance.
- A recent map of the global distribution of land subsidence lists Ranfanjan, Iran as number 1 in terms of land subsidence globally and Tehran Plain as number 4 (Fig. 1).
- A study by Haghighi and Motagh (Sci Adv., 2024) shows that subsidence rates exceed 10 cm/yr over ~3,000 km² area, with local maxima approaching 30–37 cm/yr (Fig. 2).
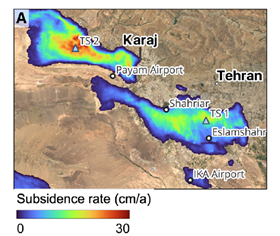
- Major Iranian cities—including Tehran, Ramin, and Karaj—are now directly affected by subsidence, with urban rates reaching ~20–25 cm/yr, posing severe risks to buildings, rail lines, and pipelines (Fig. 3).
- Annual groundwater loss is estimated from InSAR data to be ~1.7 km3, accounting for about half of the GRACE-based estimate of total water storage loss (2.8 km3 in Central Desert and Salt Lake catchments).
- More than two-thirds of the subsidence occurs in agricultural lands.
- Groundwater is overexploited, with extraction about 2× sustainable levels and about half of groundwater derived from springs and Qanats.
- Irrigation efficiency is low (<35%) and has not been updated for decades, relying on flood irrigation and related technologies.
- Groundwater depletion in Iran is also found in more humid regions, occurring even in relatively wet regions north of the Alborz and west of the Zagros Mountains due to poor surface-water capture and reliance on wells.
- Iran has constructed 100s of reservoirs to store water for use during drought, representing ~90 km3 of water storage. Recent droughts have jeopardized water supplies from reservoirs for major cities, including Tehran.
Land Subsidence in California
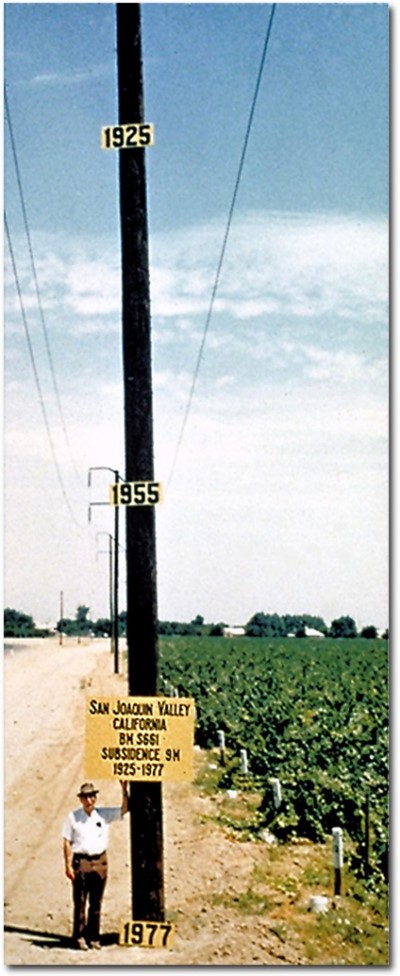
- The California Central Valley remains one of the most intensively subsiding agricultural regions globally. USGS studies quantified 9 m of subsidence in the Central Valley between 1925 and 1977 as shown by the classic photo of Joseph Poland (Fig. 4).
- Remote sensing (Interferometric Synthetic Aperture Radar, InSAR) revealed new areas of land subsidence that was not evident from previous ground-based monitoring: El Nido areas in the San Joaquin Valley show subsidence rates of 27 cm/yr (2008–2010), reflecting expanded irrigation and no access to surface water (Faunt and Sneed, 2015; Sneed and Brandt, 2015).
- The Central Valley Hydrologic Model (CVHM, V. 2) based on USGS shows 158 km3 of groundwater depletion (1962 – 2019). A total of 27 km3 of storage loss was attributed to inelastic compaction (17% of total) (Faunt et al., Water, 2024).
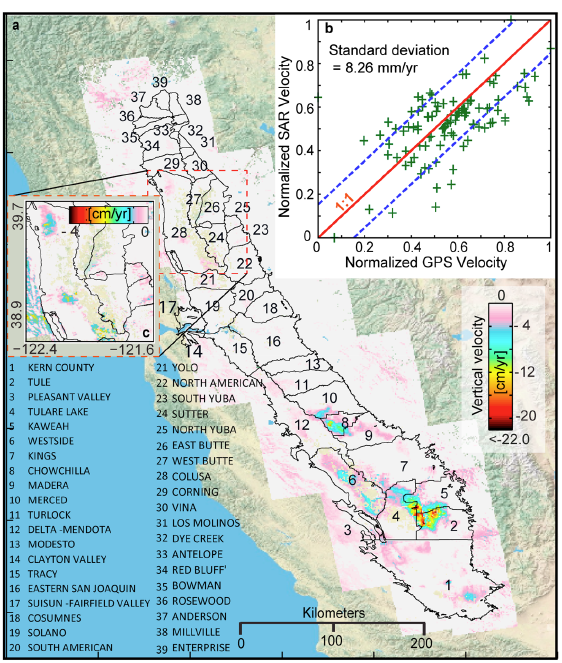
- Subsidence occurs during major droughts (e.g., 2007–2009) in California with values approaching ~30 cm/yr in the Tulare Basin (Fig. 5) (Ohja et al., WRR, 2018). Cumulative groundwater loss in the Central Valley was estimated to be 21 km3 during 2007 - 2010 (Ohja et al., WRR, 2018).
- Part of the groundwater storage capacity in the Central Valley is permanently lost (irrecoverable, inelastic storage depletion) (~ 15-20% of total groundwater storage loss). Inelastic storage loss occurs when piezometric head declines below historical pre-consolidation stress levels.
- Land subsidence may be more of a constraint than groundwater use in California, influencing groundwater regulation, infrastructure liability, and enforcement under policies such as California’s Sustainable Groundwater Management Act (SGMA). The California Department of Water Resources recently released Best Management Practices related to land subsidence (CA DWR, 2026).
Land Subsidence in Arizona
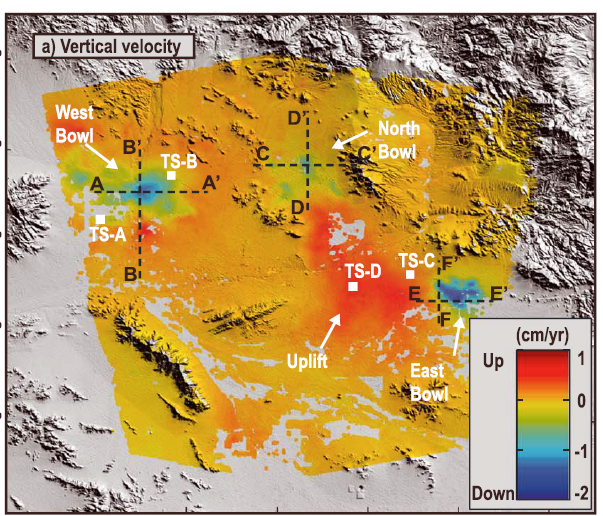
- Arizona’s Phoenix Active Management Area demonstrates both success and unintended consequences of managed aquifer recharge (MAR), with uplift occurring near recharge basins while subsidence persisting along basin margins (Fig. 5). Subsidence was monitored in the West valley (-1.39 cm/yr), North valley (-0.75 cm/yr), and East valley (-1.83 cm/yr with uplift in the central portion (0.60 cm/yr) (Fig. 4) (Miller and Shirzaei, JGRSE, 2015).
- Differential uplift and subsidence in Phoenix create new infrastructure risks, as even small elevation changes disrupt drainage gradients, canals, and linear infrastructure such as roads and pipelines.
- Some areas experience residual land subsidence even when hydraulic heads are rising because the clays continue to dewater and compact after groundwater extraction has discontinued.
Subsidence along US Coasts and Impacts on Relative Sea Level Rise
- Along coasts, relative sea-level rise rather than absolute sea-level rise may represent a greater hazard, combining sea level rise with vertical land motion from subsidence (Shirzaei et al., NREE, 2021l Shirzaei et al., AREPS, 2026).
- In many densely populated coastal zones, subsidence currently exceeds global mean sea-level rise rates, indicating that vertical land motion is the dominant near-term driver of flooding, saltwater intrusion, and infrastructure failure in many regions (Ohenhen et al., Nature, 2024).
- Analysis of coastal subsidence does not consider any infrastructure constructed to defend these areas (undefended scenarios) (Ohenhen et al., Nature, 2024).
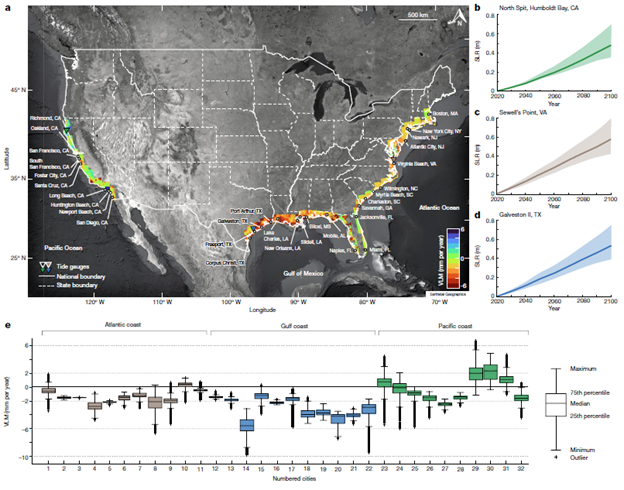
- US mainland coast is characterized by three regimes of subsidence (Fig. 6):
- East coast (passive margin, sandy flat, low rates of subsidence except locally),
- Gulf Coast, large rates of subsidence related to oil and gas production, water extraction etc., and
- West Coast: steep topography, active subduction zone, low rates of subsidence. Some areas, like San Francisco subsiding 1 cm/yr but most areas few mm/yr.
- The U.S. Gulf Coast exhibits the most rapid rates of coastal subsidence, driven by sediment compaction, groundwater extraction, and legacy oil-and-gas production, resulting in vertical land motion rates often 4–5× greater than sea-level rise (Ohenhen et al., Nature, 2024).
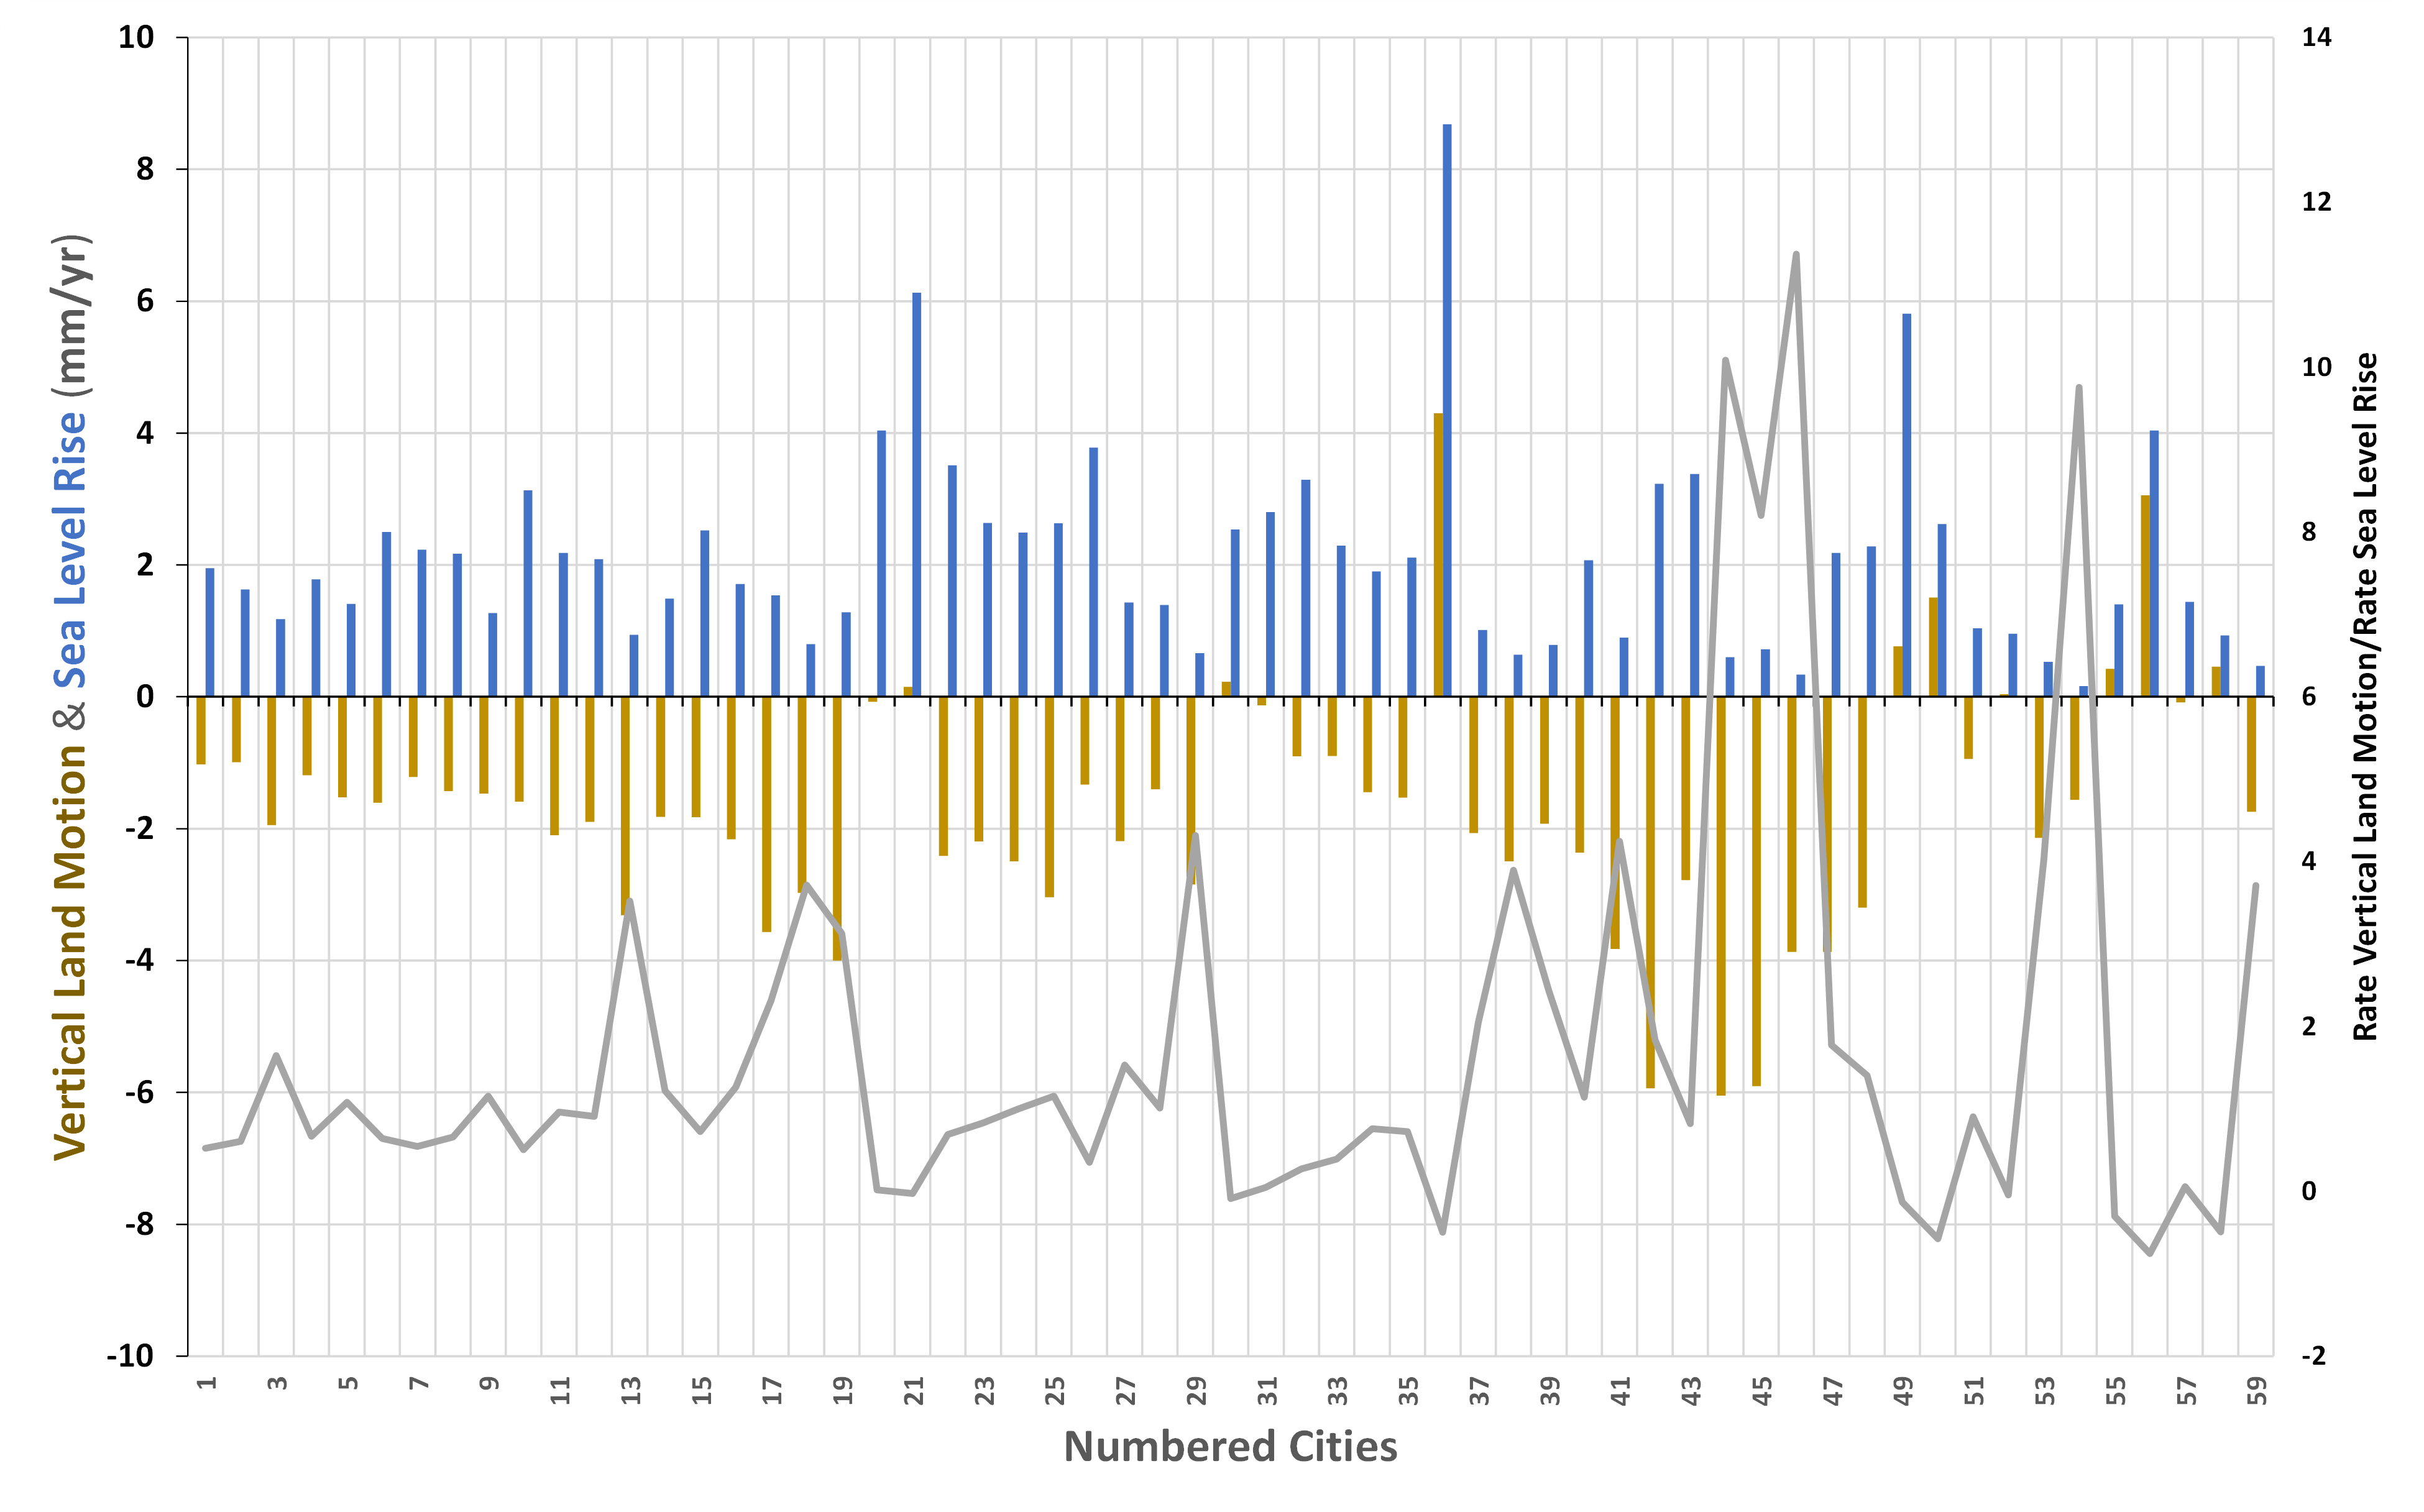
- Cities with rate of vertical land motion relative to rate of sea level rise ≥4 include Charleston Island, Galveston and Freeport region, Redwood City and Monterey (Fig. 8).
- Some areas in the West coast are rising related to managed aquifer recharge (MAR): Santa Clara and Santa Ana aquifers near Los Angeles.
- Results show that ~1000–1400 km2 of land area is threatened by relative sea level rise by 2050, exposing ~55,000–273,000 people (Ohenhen et al., Nature, 2024).
Methods of Monitoring Land Subsidence
- A variety of approaches have been developed to monitor land subsidence, including InSAR, GPS, and leveling (Shirzaei et al., NREE, 2021).
- Subsidence from InSAR in inland areas can be used to estimate groundwater storage changes by combining InSAR with groundwater head data.
- Elastic and inelastic (irrecoverable) subsidence can be quantified by applying frequency analysis to InSAR data (seasonal fluctuations generally reflect elastic storage changes whereas long-term trends mostly represent inelastic storage changes. However, knowledge of pre-consolidation stress is also required to make this conclusion.
- Coastal subsidence monitoring approaches and drivers are described in detail in Shirzaei et al., NREE, 2021 and in Shirzaei et al., AREPS, 2026.
- Shirzaei and his team have developed a tool to characterize areas at risk from land subsidence, combining physics-based models with AI (Random Forest, Convolutional Neural Networks, etc.) to map areas and populations at risk in coastal zones from subsidence.
- Advanced satellite monitoring (InSAR, GRACE, GNSS) combined with AI now enable proactive risk prioritization, shifting subsidence management from reactive damage repair to targeted, cost-effective intervention for critical infrastructure.