Listen here on Spotify | Listen here on Apple Podcast
Episode released on July 16, 2026
Episode recorded on May 18, 2026
 Katie Smye talks about advanced modeling and satellite-based monitoring for tracking produced water issues in the Permian Basin.
Katie Smye is a Research Associate Professor at the Bureau of Economic Geology within the Jackson School of Geosciences at the University of Texas at Austin. She serves as a Principal Investigator for the Center for Injection and Seismicity Research (CISR). Her research focuses on basin-scale geologic characterization of formations utilized for injection of hydraulic fracturing flowback and produced water. She has experience in most shale oil and gas plays in the U.S., including the Permian Basin, Eagle Ford, Marcellus, Haynesville, Barnett, and Bakken.
Highlights | Transcript
- Environmental Impacts of Produced Water Management
- Produced water blowouts are a visible symptom of subsurface pressure problems in the Permian Basin.
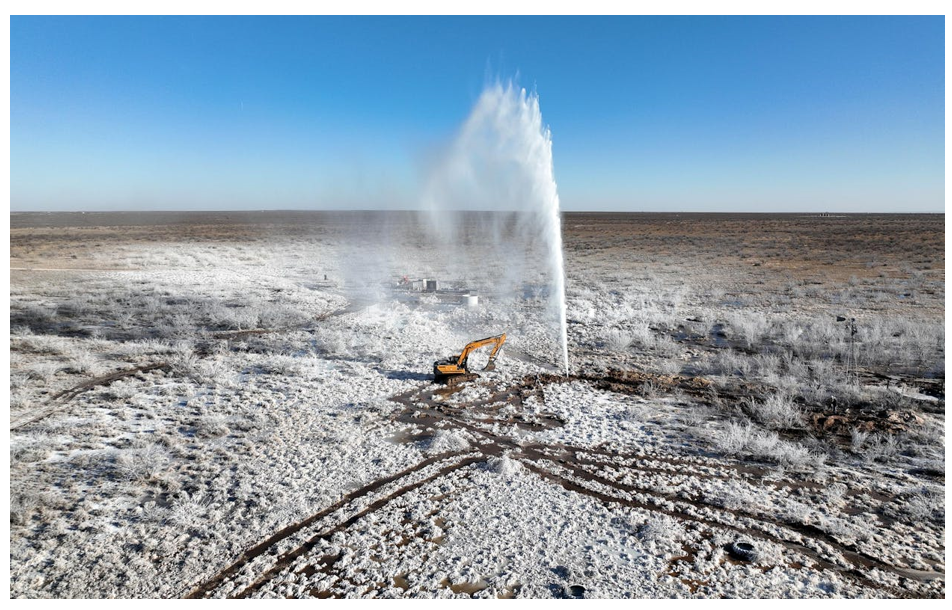
Katie Smye described recent high-profile brine releases and geysers in Grand Falls (Baptist Church, Ward County), Crane County (Fig. 1, Gold, Texas Monthly, Jan. 2022), Reeves County (e.g., well blowout near Toyah, Oct. 2024, TX Tribune) in the Permian Basin. These events involve highly saline brine escaping to the surface through legacy wellbores or other pathways, signaling significant subsurface pressure increases.
- Produced water blowouts are a visible symptom of subsurface pressure problems in the Permian Basin.
- Produced Water Volumes
- The Permian Basin produces large volumes of water with oil.
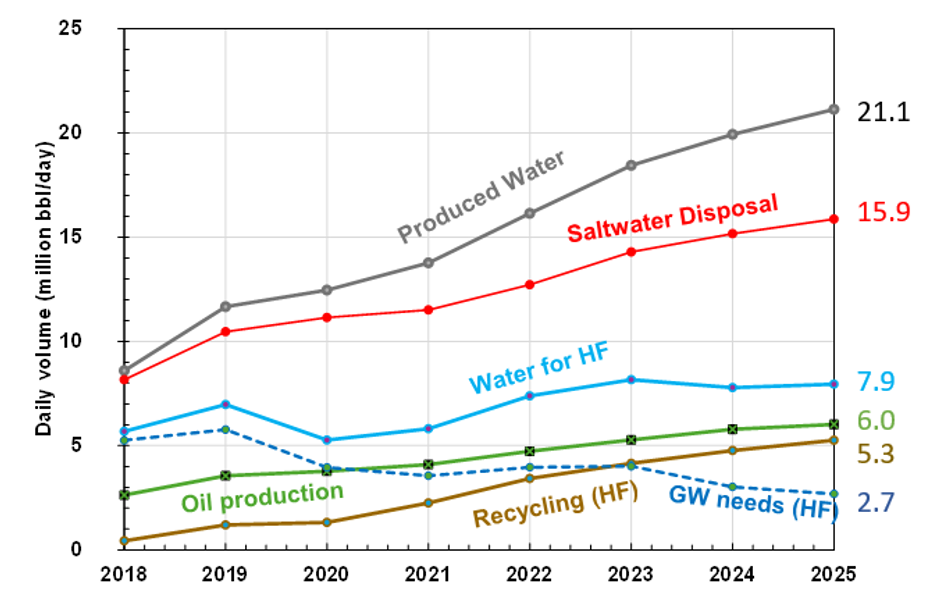
Volumes of produced water in the Permian Basin total ~21 million barrels per day (2025, Mbbl/d; Fig. 2), equivalent to roughly one Olympic-sized swimming pool every one to two minutes. The Permian now accounts for about half of U.S. oil production, and many reservoirs produce 3–5 bbl of water for every barrel of oil. - The transition from conventional to unconventional production created the modern produced water problem.
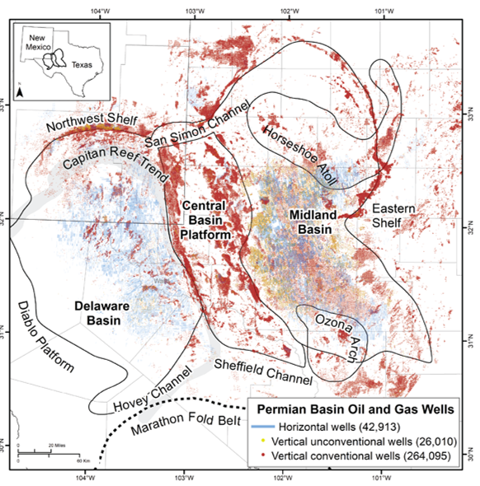
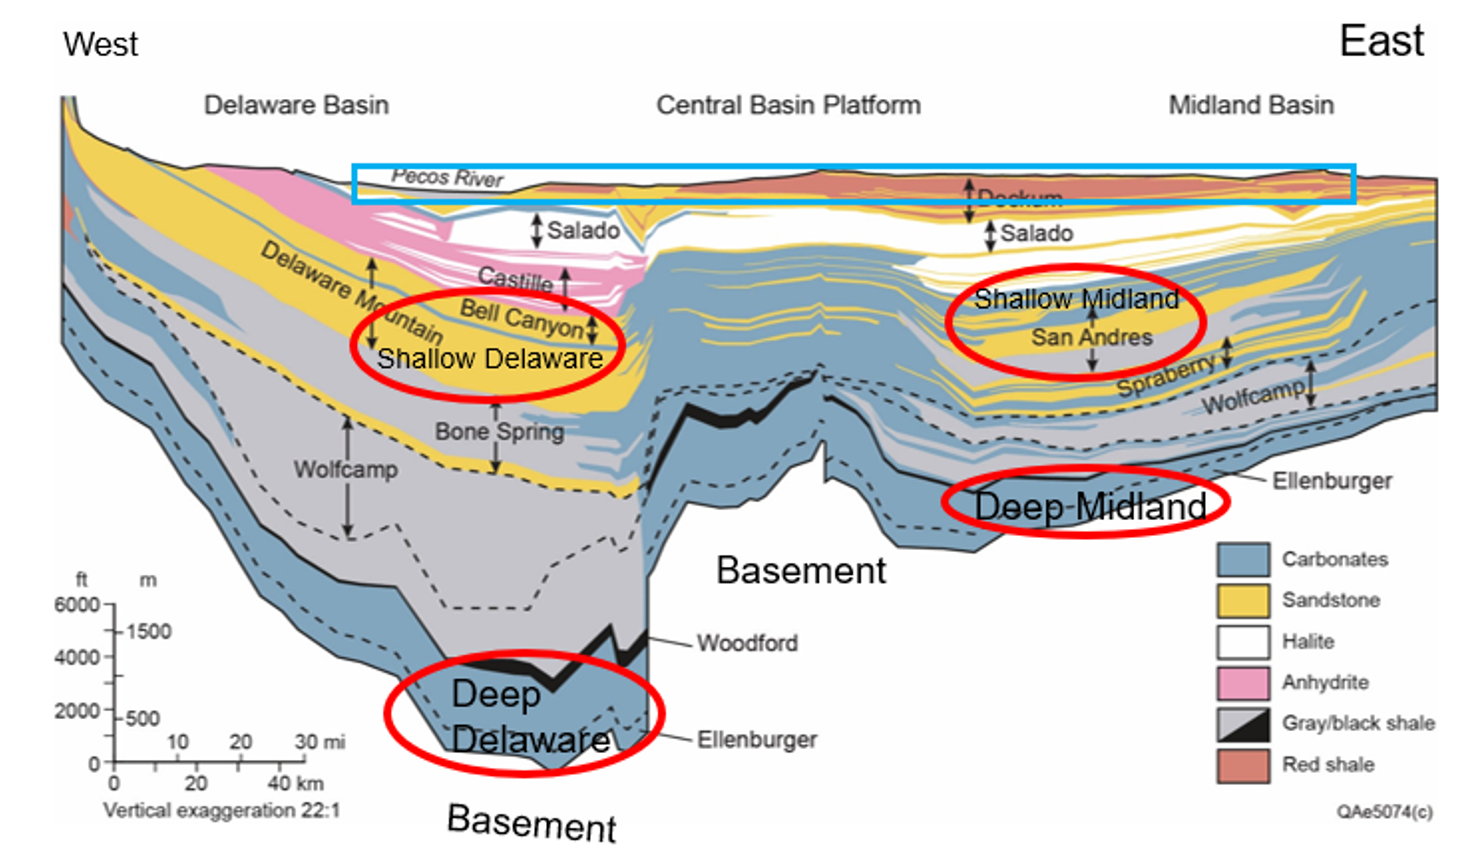
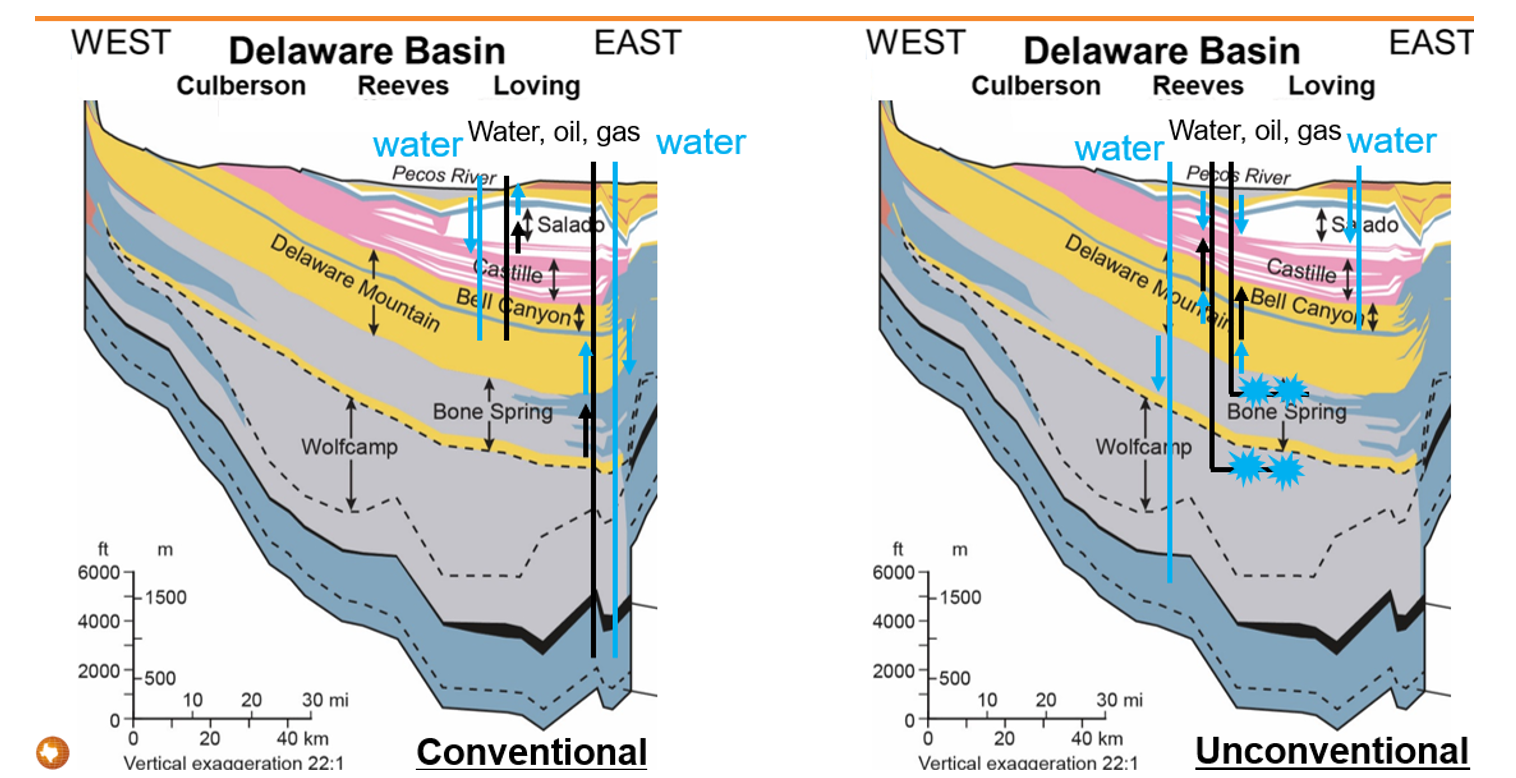
The Permian Basin includes conventional reservoirs (e.g., primarily in the Central Basin Platform, Shelves, and Midland Basin) and unconventional reservoirs in shale basins (Midland Basin and Delaware Basin) (Fig. 3). The west–east cross section shows the unconventional plays (Wolfcamp and Bone Spring units in Delaware Basin and Wolfcamp and San Andres in Midland Basin) separated by the conventional reservoir in the Central Basin Platform (Fig. 4). Conventional reservoirs generally have sufficient permeability to allow reinjection of produced water into the reservoir to maintain reservoir pressure for enhanced oil recovery (Fig. 5). In contrast, unconventional shale reservoirs, which are the source rocks, require hydraulic fracturing and long lateral wells (2–3 miles long) to produce sufficient volumes of oil and gas. The low permeability of the shales precludes disposal of produced water, forcing disposal into other formations and creating pressure-management challenges. - Even aggressive produced water treatment programs would leave substantial residual concentrate requiring disposal.
Currently ~70% of water used for hydraulic fracturing is sourced from produced water (Fig. 2). However, even if all water requirements for hydraulic fracturing were met with produced water (7.9 M bbl/d in 2025) there would still be 13.2 M bbl/d of produced water. The Texas Produced Water Consortium is evaluating various approaches for treating produced water and estimate an average of ~50% recovery. Even if all the remaining produced water after reuse for hydraulic fracturing was treated, about 6.6 Mbbl/d of concentrate would remain for disposal. This volume represents ~30% of current produced water volumes. These data underscore the need to optimize management of produced water for long-term disposal.
- The Permian Basin produces large volumes of water with oil.
- Produced Water and Seismicity
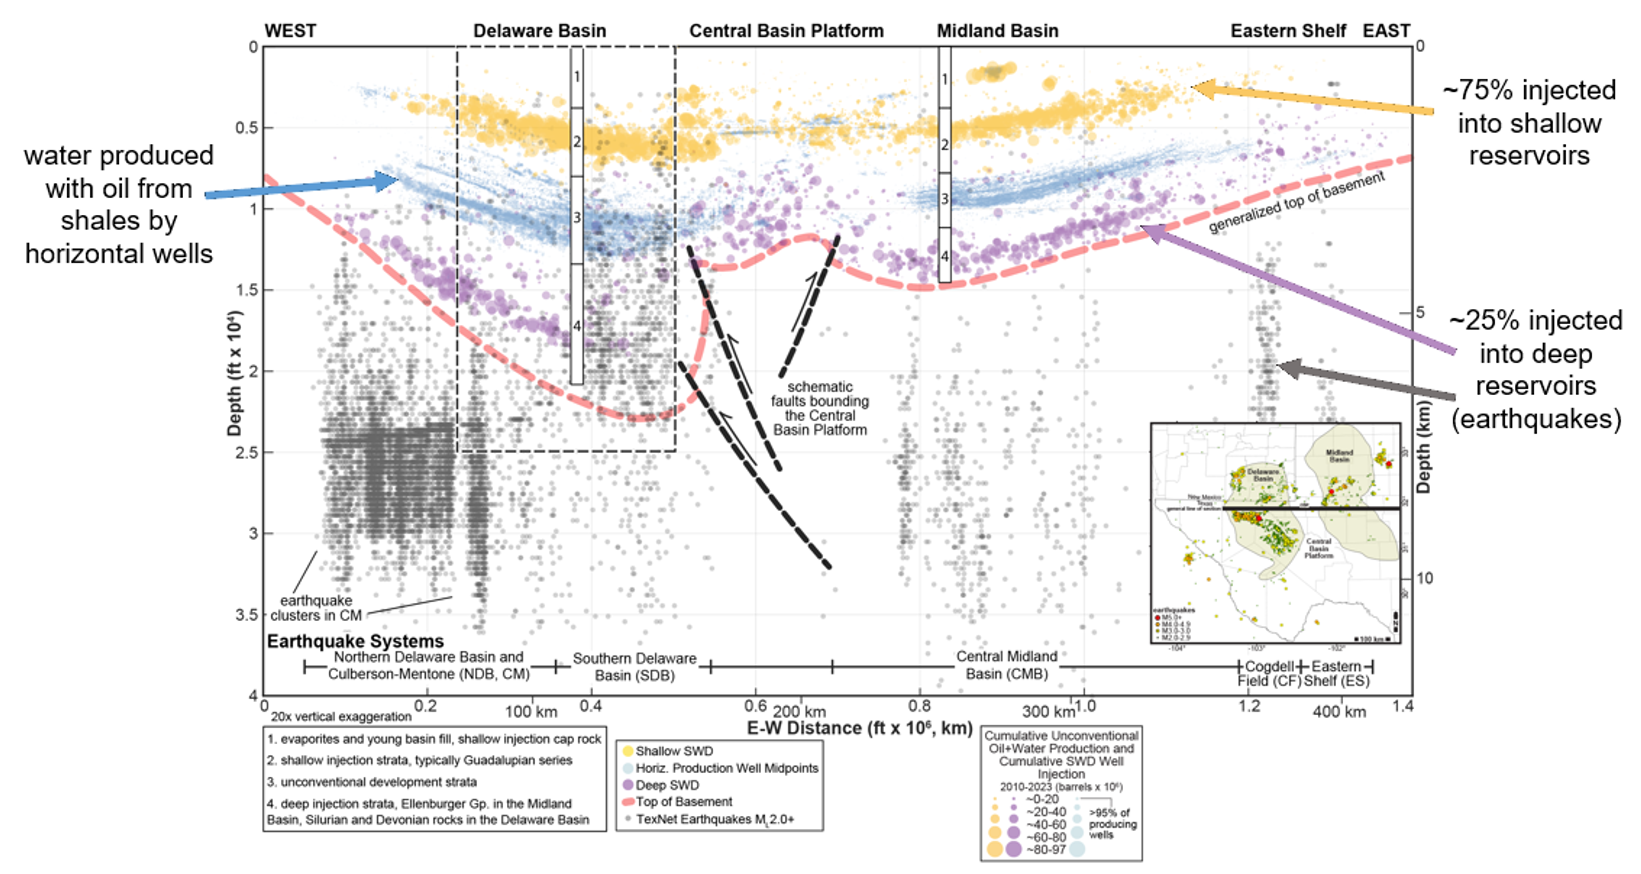
- Nearly all unconventional produced water that is not recycled for hydraulic fracturing is injected for permanent disposal into strata shallower (~70% of injection) or deeper (~25%) than shale reservoirs (Fig. 6). The produced water is injected using saltwater disposal (SWD) wells that represent ~10% of the total number of modern oil and gas industry wells in the Permian.
- Deep disposal near basement faults is strongly linked to induced seismicity.
Lessons from Oklahoma demonstrated that injection near crystalline basement rock (Arbuckle Formation in Oklahoma, Ellenburger Gp. in Fort Worth Basin, and Ellenberger Gp. and Silurian-Devonian Fms. in Permian Basin) can trigger earthquakes on basement-rooted faults. Even relatively small pressure increases—equivalent to tens of psi—can induce fault slip and seismic events at distances of tens of kilometers from injection wells. - Tradeoffs between deep and shallow disposal.
Deep disposal below oil and gas producing formations increases seismicity risk, whereas shallow disposal above producing zones can cause reservoir pressurization, drilling complications, blowouts, and potential groundwater impacts. - Induced seismicity rates in Oklahoma and the Permian Basin have at times rivaled California.
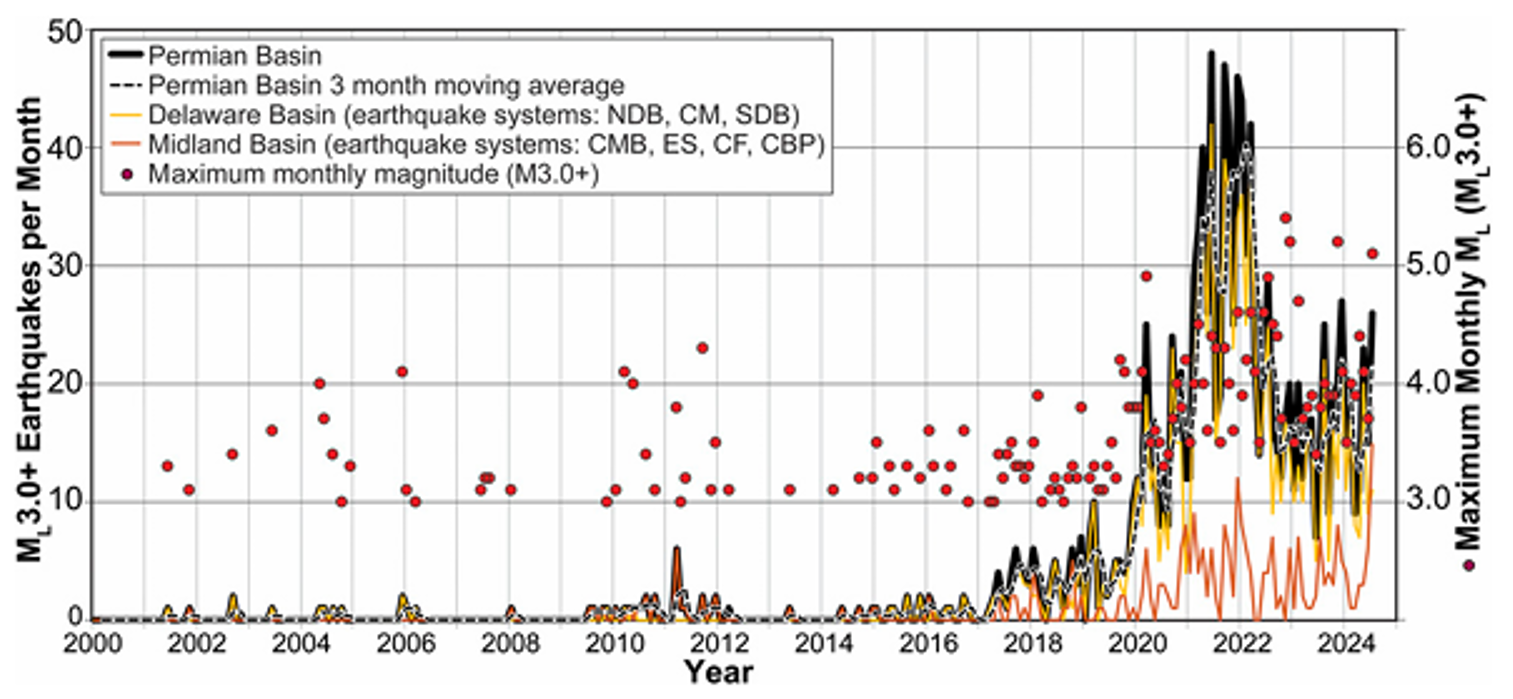
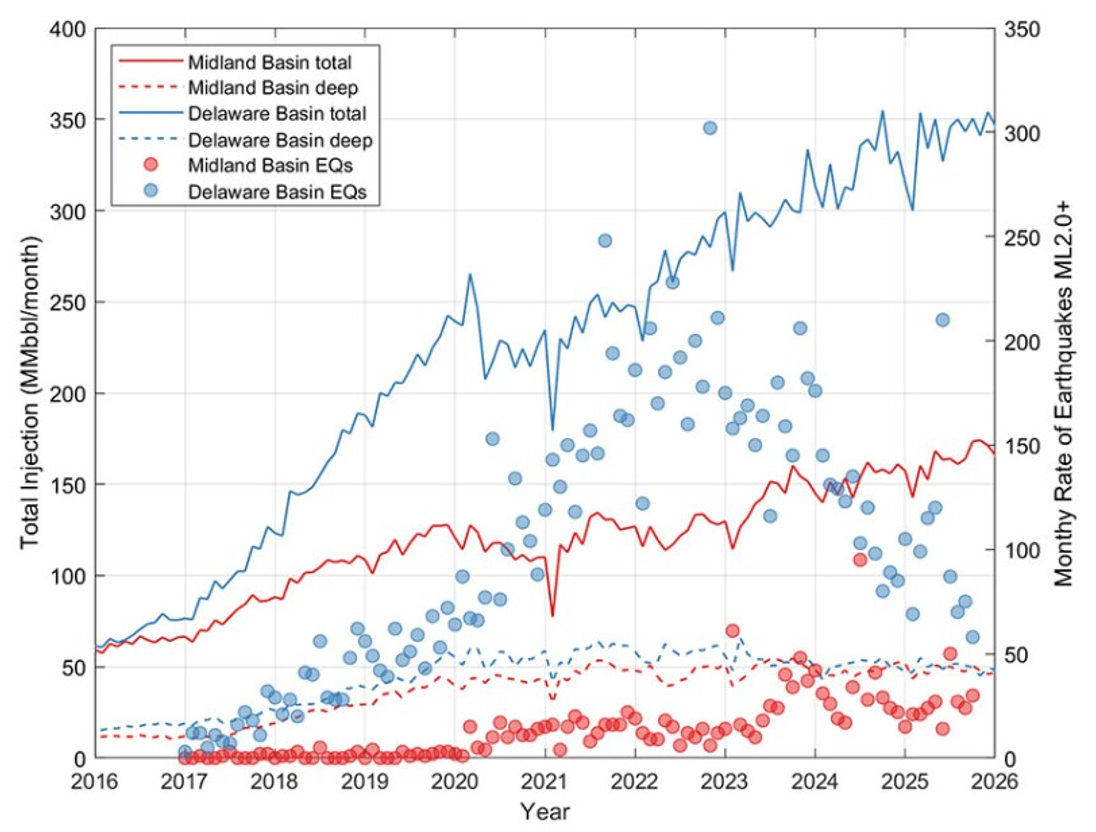
Earthquake activity peaked in Oklahoma during 2015–2017, and in 2022–2023 in the Permian Basin peaked (Fig. 7). In some years, earthquake rates in these regions were comparable to those observed in naturally active seismic regions such as California. - Overpressurization in reservoirs is linked to saltwater disposal.
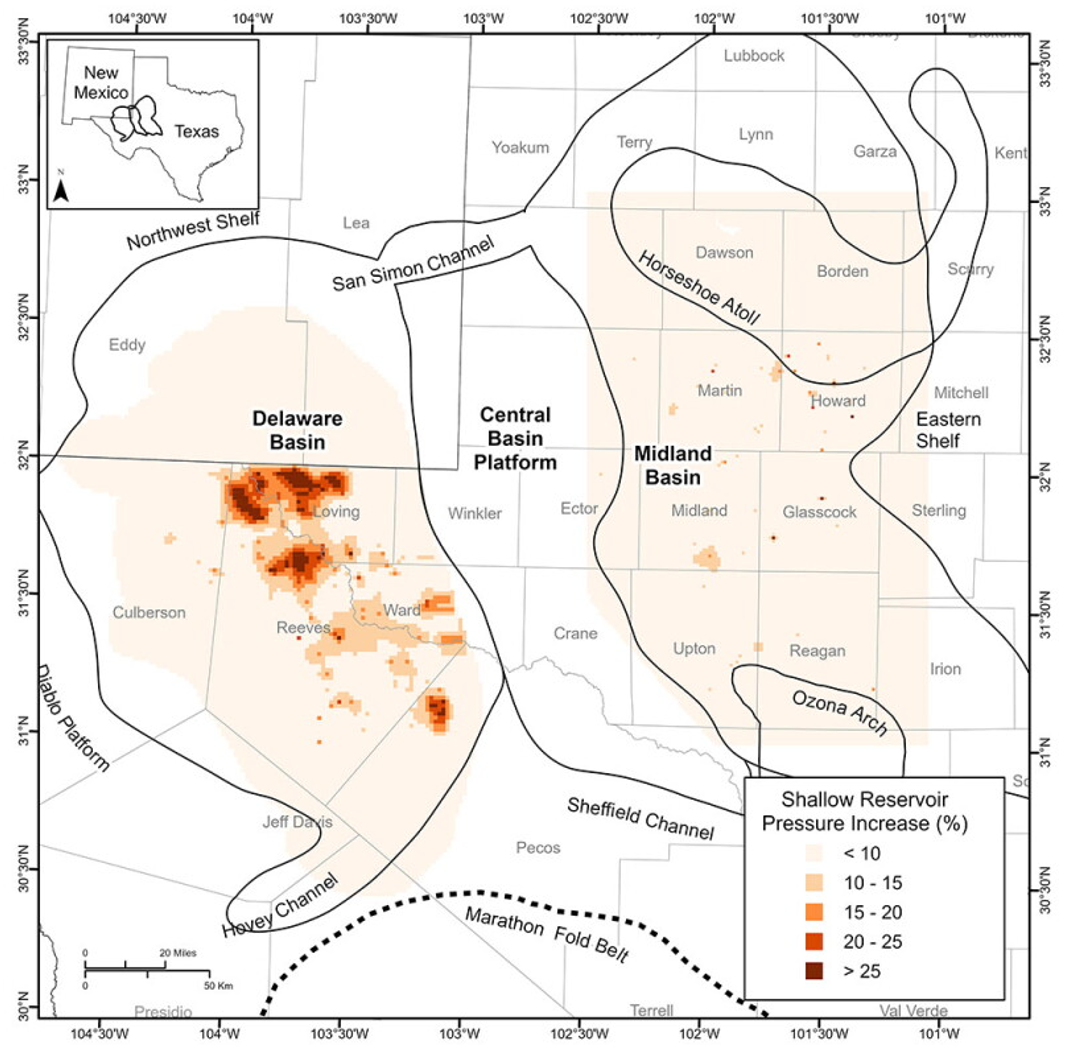
Modeling analysis shows increases in subsurface pressure linked to saltwater disposal (Fig. 8). For example, disposal of 5.8 billion bbl (0.9 km3) of produced water has resulted in regional pressure increases in the Delaware Mountain Group in the range of 200–400 psi (Ge et al., JoH, 2022) and currently up to 1000 psi at individual wells (Smye et al., JPT Guest Editorial, 2026). - Regulatory actions through Seismic Response Areas have successfully reduced earthquake rates.
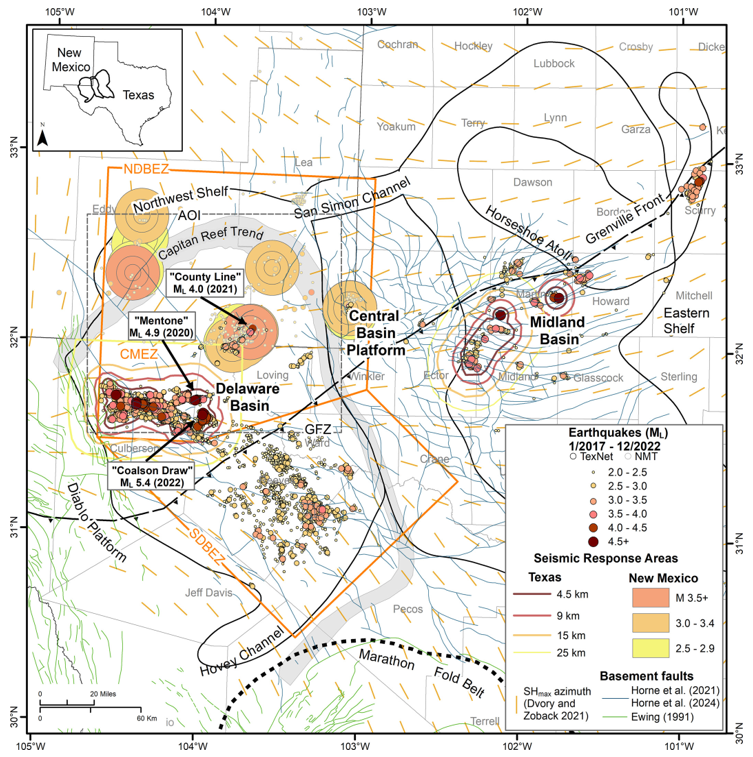
Texas and New Mexico established Seismic Response Areas where disposal volumes are monitored and curtailed when necessary (Fig. 9). These measures have significantly reduced earthquake occurrence, including a nearly two-thirds reduction in the North Culberson-Reeves Seismic Response Area near the Texas–New Mexico state line since 2023 (Fig. 10). - Differences between Texas and New Mexico regulations strongly influence produced water movement.
New Mexico restricts shallow disposal because of concerns about impacts on producing reservoirs and correlative rights, while Texas permits extensive shallow disposal. As a result, several million barrels per day of produced water are transported from New Mexico into Texas for disposal. - Cross-border water movement contributes to disposal pressures in West Texas.
The transfer of produced water across the Texas–New Mexico state line creates highly concentrated shallow disposal zones in Texas. These areas correspond to regions experiencing blowouts, surface flows, and other pressure-related issues.
- Potential Impacts of Produced Water Management on Overlying Aquifers and Land
- Legacy wells increase risks of fluid migration.
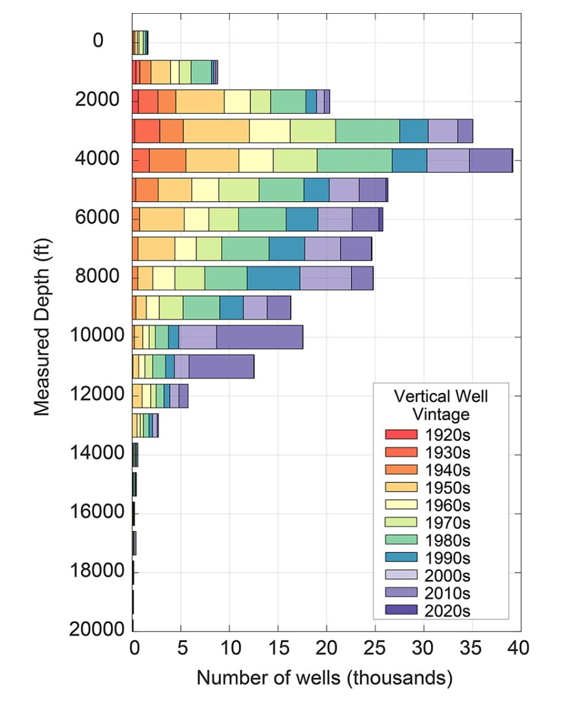
The Permian contains hundreds of thousands of older wells, many drilled decades before modern casing and plugging standards (Fig. 11). In addition, these wells were not designed to withstand the increases in subsurface pressure from saltwater disposal over the past decade. These legacy wells provide potential pathways for fluid migration to shallower formations, brackish and freshwater aquifers, and the surface. - Compromised caprock increases risk of impacts of saltwater disposal on overlying aquifers: The disposal units are generally separated from overlying brackish and fresh aquifers by caprock, that includes the Salado and Castille formations, made up of anhydrite and halite. However, dissolution of some of these units over geologic time has compromised the integrity of these units and increased the risk of impacts of saltwater disposal in overlying aquifers.
- Satellite InSAR monitoring provides a powerful early-warning tool for subsurface pressurization.
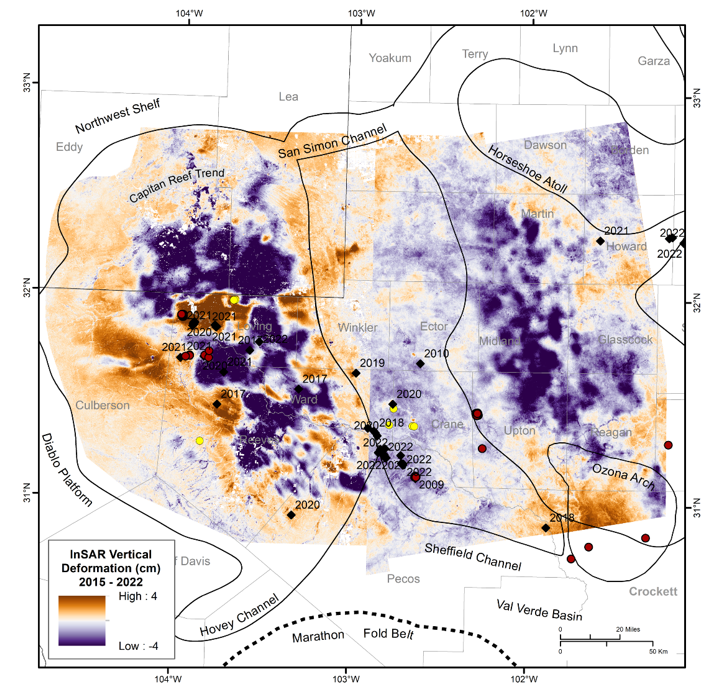
Surface uplift detected by satellite measurements from Interferometric Synthetic Aperture Radar (InSAR) reveals where injection is increasing subsurface pressures (Fig. 12). Areas with significant uplift are strongly associated with flowing wells and blowouts, suggesting that InSAR, combined with pressure modeling, could help prioritize monitoring, well plugging, and proactive risk mitigation efforts. - Beneficial use of produced water remains promising but faces major technical and economic barriers.
Potential uses include agricultural irrigation, rangeland restoration, surface water augmentation, aquifer recharge, and extraction of critical minerals such as lithium. However, the extreme salinity of produced water, high treatment costs, energy requirements for desalination, and scaling challenges currently limit widespread implementation.
- Legacy wells increase risks of fluid migration.
Key Takeaway
- The central message of the discussion is that produced water management is becoming one of the most important near- and long-term challenges facing the Permian Basin. While recycling, treatment, and beneficial reuse may reduce disposal volumes, large-scale subsurface disposal will remain necessary for decades. Although tens of billions of barrels of prior injection for permanent disposal in the Permian Basin have been managed, several hundred billion barrels are likely as production is maintained in the basin. Improving understanding of pressure buildup, seismicity, legacy well risks, and reservoir capacity is therefore essential not only for produced water management but also for future subsurface storage applications such as carbon capture and storage, hydrogen storage, and other energy-transition technologies.