Listen here on Spotify | Listen here on Apple Podcast
Episode released on September 4, 2025
Episode recorded on July 15, 2025
 Landon Marston discusses rising water intensity of large data centers resulting in notable impacts on local water demand.
Landon Marston is a professor in Environmental and Water Resources Engineering at Virginia Tech University. His research focuses on developing solutions towards more sustainable water management. He has quantified how and where water is used in the economy and the related environmental impacts. This podcast focuses on the environmental footprint of data centers in the US, including water and greenhouse gases (ghg).
Highlights | Transcript
Environmental Footprints of Data Centers
- AB Siddik, Arman Shehabi and Landon Marston evaluated the water and carbon impacts of data centers in the US in the paper titled: “The environmental footprint of data centers in the United States”, Siddik et al., ERL, 2021.
- Global electricity demand of data centers: 205 TWh in 2018 (1% of global electricity demand)
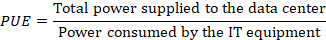
- U.S. accounted for ~45% of data center servers globally with ~ 5,400 in 2024, followed by Germany, the UK, and China with an order of magnitude lower numbers than the US (Fig. 1).
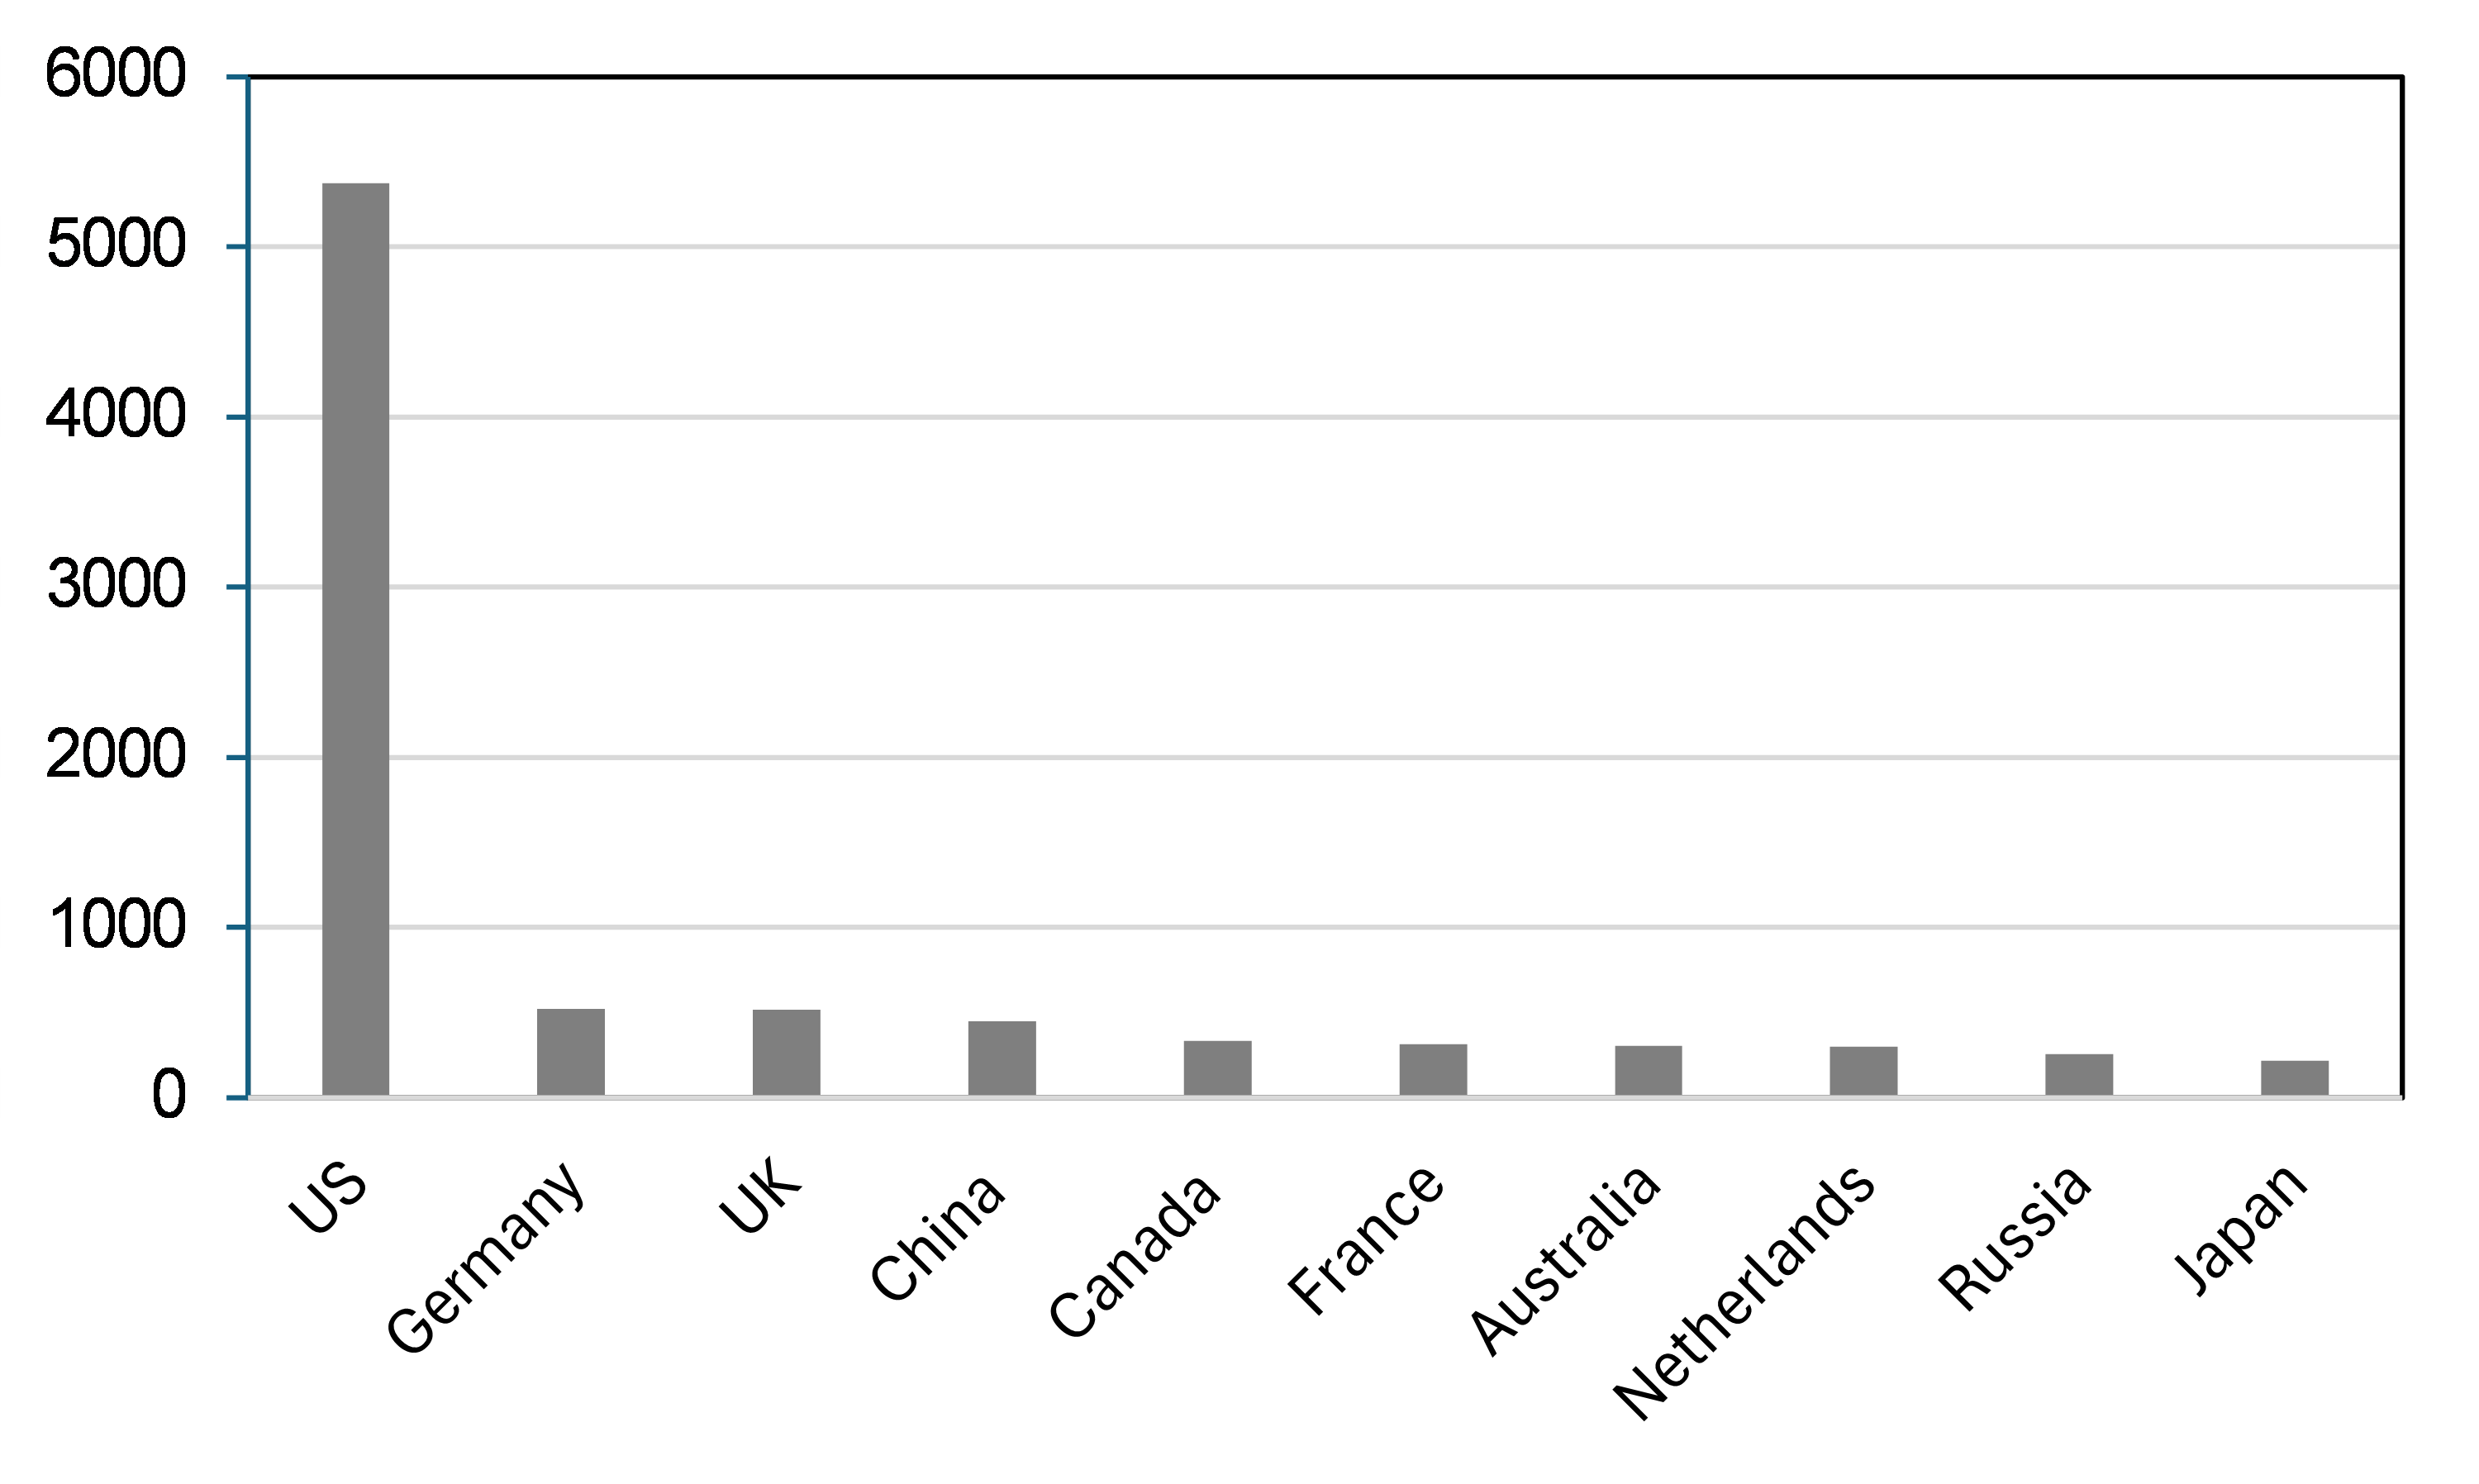
- Distribution of data centers in the US along with transmission lines, fiber optic lines, and operating status are shown in Fig. 2 (NREL, 2025)
- Virginia: data center capital of world (30% of global data center capacity), cheap land, key fiber optics, reliable power sources, skilled labor.
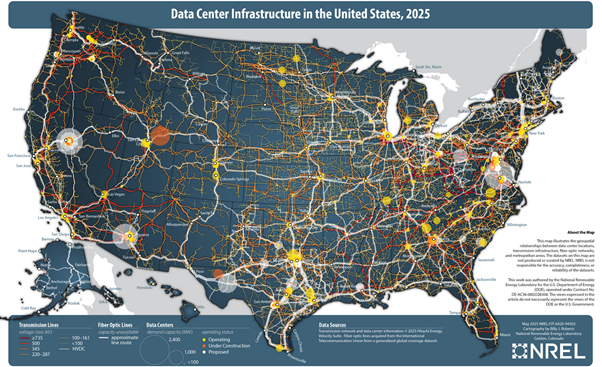
- Electricity use (Fig. 3; Shehabi et al., LBL, 2024)
- 76 TWh (1.9% of US electricity, 2018),
- 176 TWh (4.4% of US electricity in 2023)
- 325 – 580 TWh (6.7 – 12% of US electricity in 2028)
- Data center computing workloads increased by 550% from 2010 – 2018 but electricity consumption only increased 6% because of improved energy efficiency and storage drive density.
- Different types of data centers:
- Local, in-house data centers
- Co-location data centers: (retail, wholesale, hybrid cloud), multi-tenant
- Hyperscale data centers
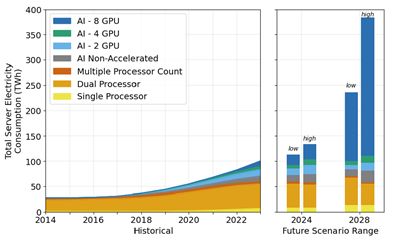
- Electricity use varies by data centers, dominated by dual processor units in the past and projected to be dominated by 8 GPU AI processors in the future (Fig. 4)
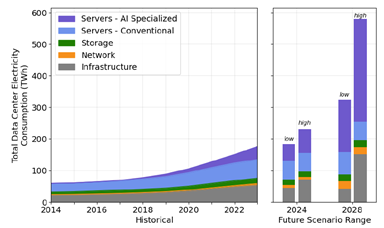
- The importance of AI centers is projected to increase in the future (Fig. 5).
- Data centers require uninterruptible power supply (24/7/365), difficult to manage power demand in response to variability in electricity or water availability
- We all use data centers all the time for streaming Netflix, zoom calls etc.
- Many factors (~ 100) drive the location of data centers:
- Access to electricity
- Availability of water and land
- Fiberoptics
- Proximity to major centers (especially for transmitting data back and forth where latency is important)
- Tax incentives
- Skilled workforce
- Hyperscale data centers often don’t require rapid transmission and can be built in remote areas (esp. large AI data centers)
- Companies that run data centers include:
- Meta, Amazon, Microsoft, or Google
- Many major technology companies that operate data centers indicate that they hope to become water neutral or even negative by 2030 by reducing their water consumption and replenishing water. This is especially true for data centers that focus on training AI models.
Methodology to Estimate Energy and Water Use for Data Centers:
- No national database or metered water use for data centers or for other sectors
- Estimated water use based on different coefficients (Siddik et al., ERL, 2021)
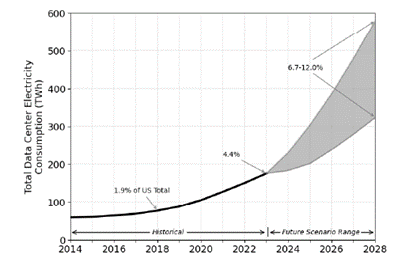
- Power Usage Effectiveness (PUE) from literature:
- Ideal value: PUE = 1, meaning all electricity is used for IT
- Hyperscale centers: PUE = 1.2 – 1.3
- In house data centers, much less efficient, PUE ~ 2
- Water Usage Effectiveness (WUE)
- WUE (site) cooling infrastructure at data center
- WUE (source) based on electricity use at data center
- WUE (site) cooling infrastructure at data center
- The area (ft2) of data centers is also important for estimating energy and water use.
- Electricity use per unit area
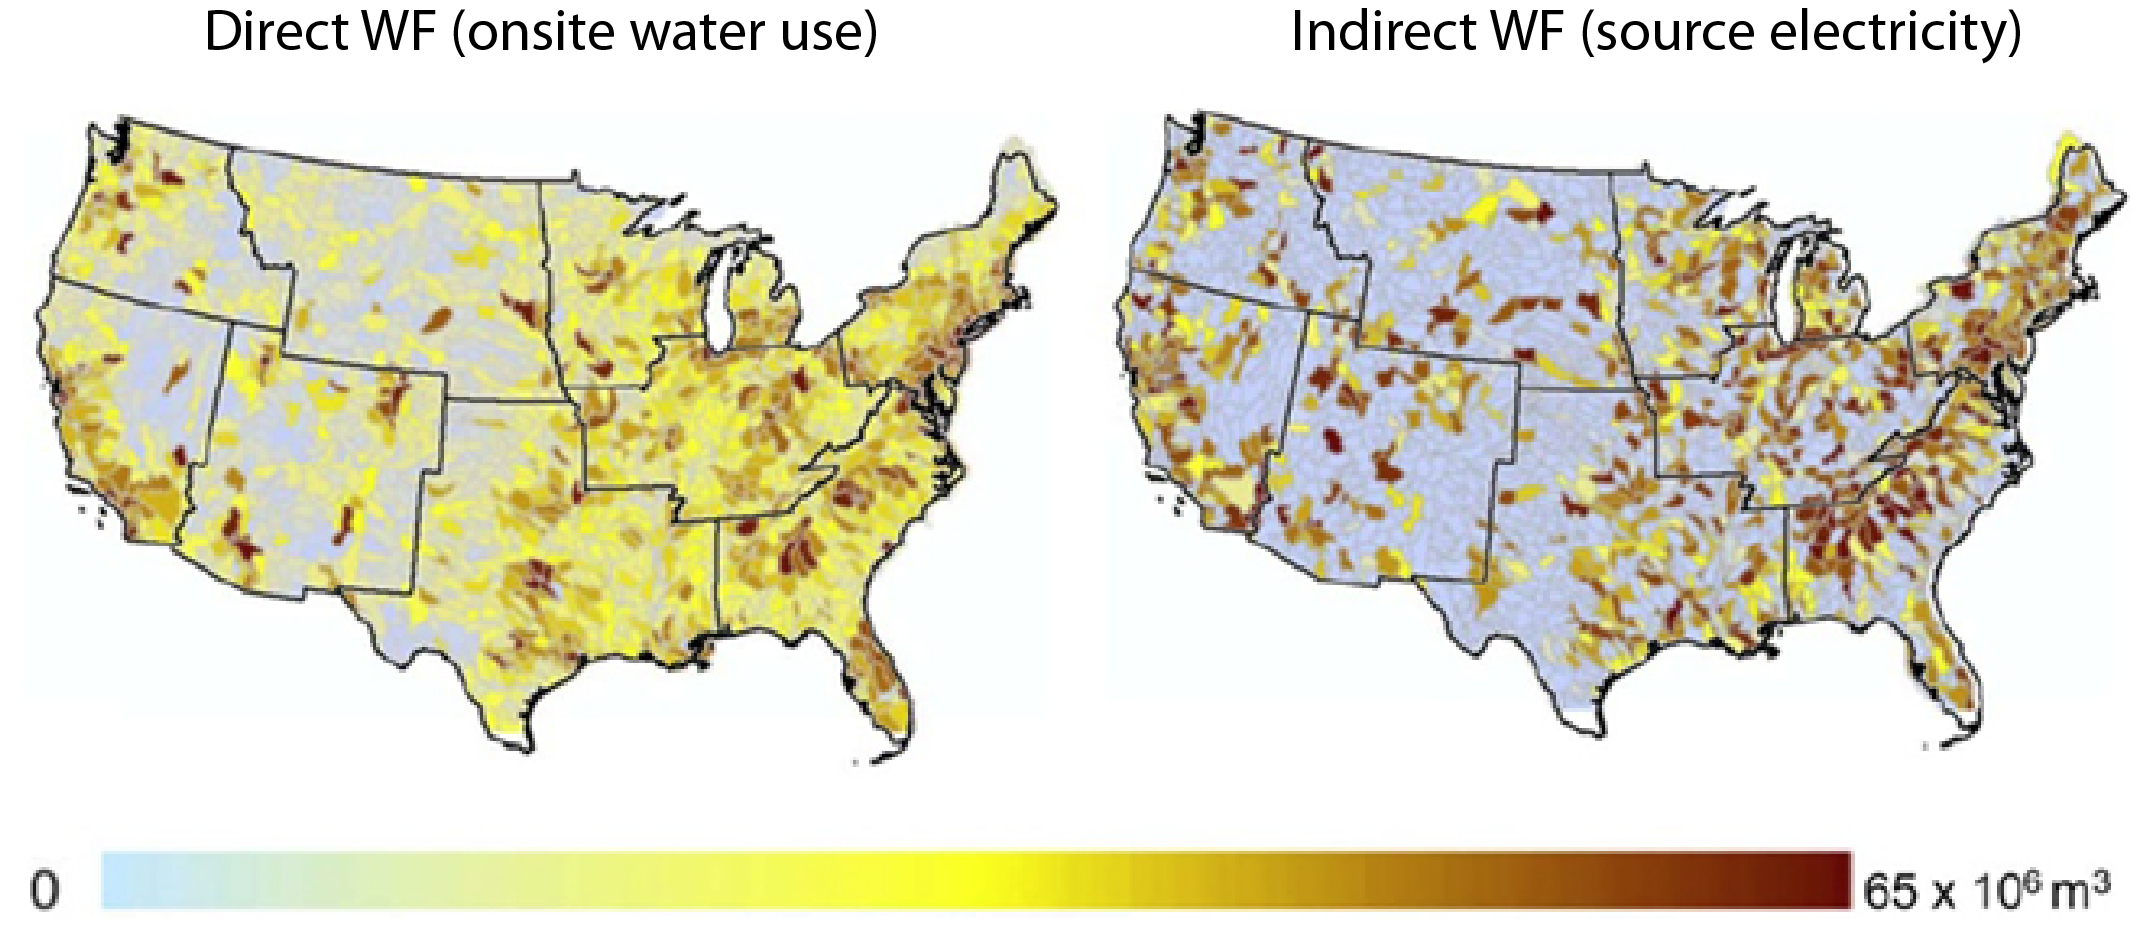
- Direct water footprint of a data center = heat generation capacity (related to amount of electricity used) multiplied by typical water-cooling requirement (1.8 m3/MWh) (Siddik et al., ERL, 2021).
- Direct water footprint of data centers varies by cooling system, highest in open loop water cooled systems (cooled by water evaporation), intermediate in closed-loop systems, and lowest in air cooled systems.
- There is a tradeoff in water use versus energy use for cooling at data centers with water cooled having lowest energy use and air cooled having highest energy use.
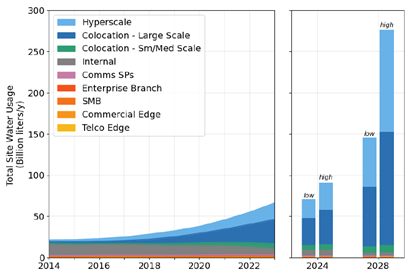
- Direct water use varies by data center type and is projected to be dominated by collocation and hyperscale centers in the future (Fig. 7).
- Indirect water footprint: based on
- electricity used during data center operation
- electricity used by water and wastewater treatment plants
- Electricity source by data center estimated based on electricity generation and use in a Power Control Area (PCA)
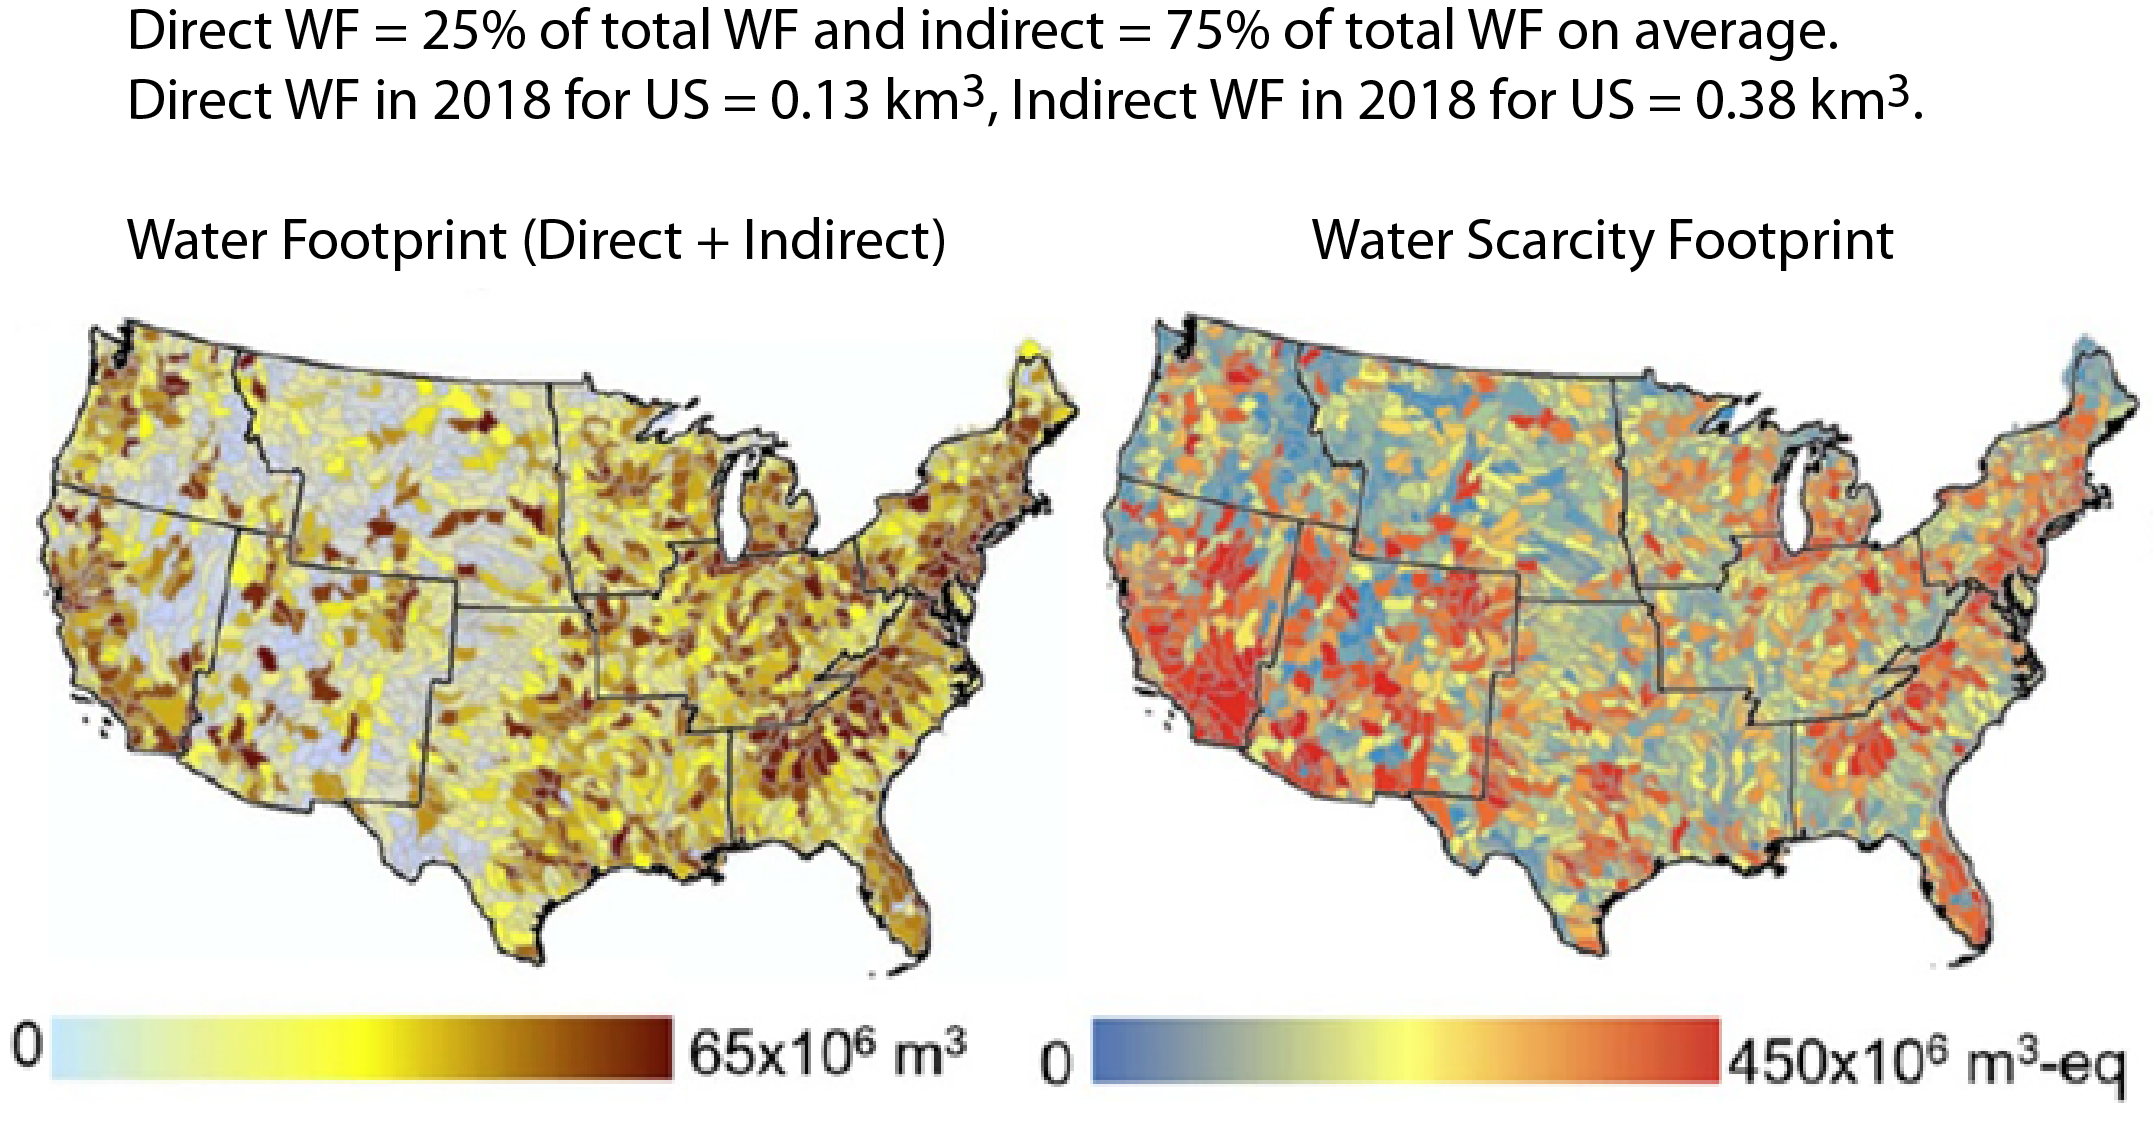
- The spatial distribution of direct and indirect water footprint by subbasin (8-digit Hydrological Unit Code; HUC8) is shown in Fig. 8.
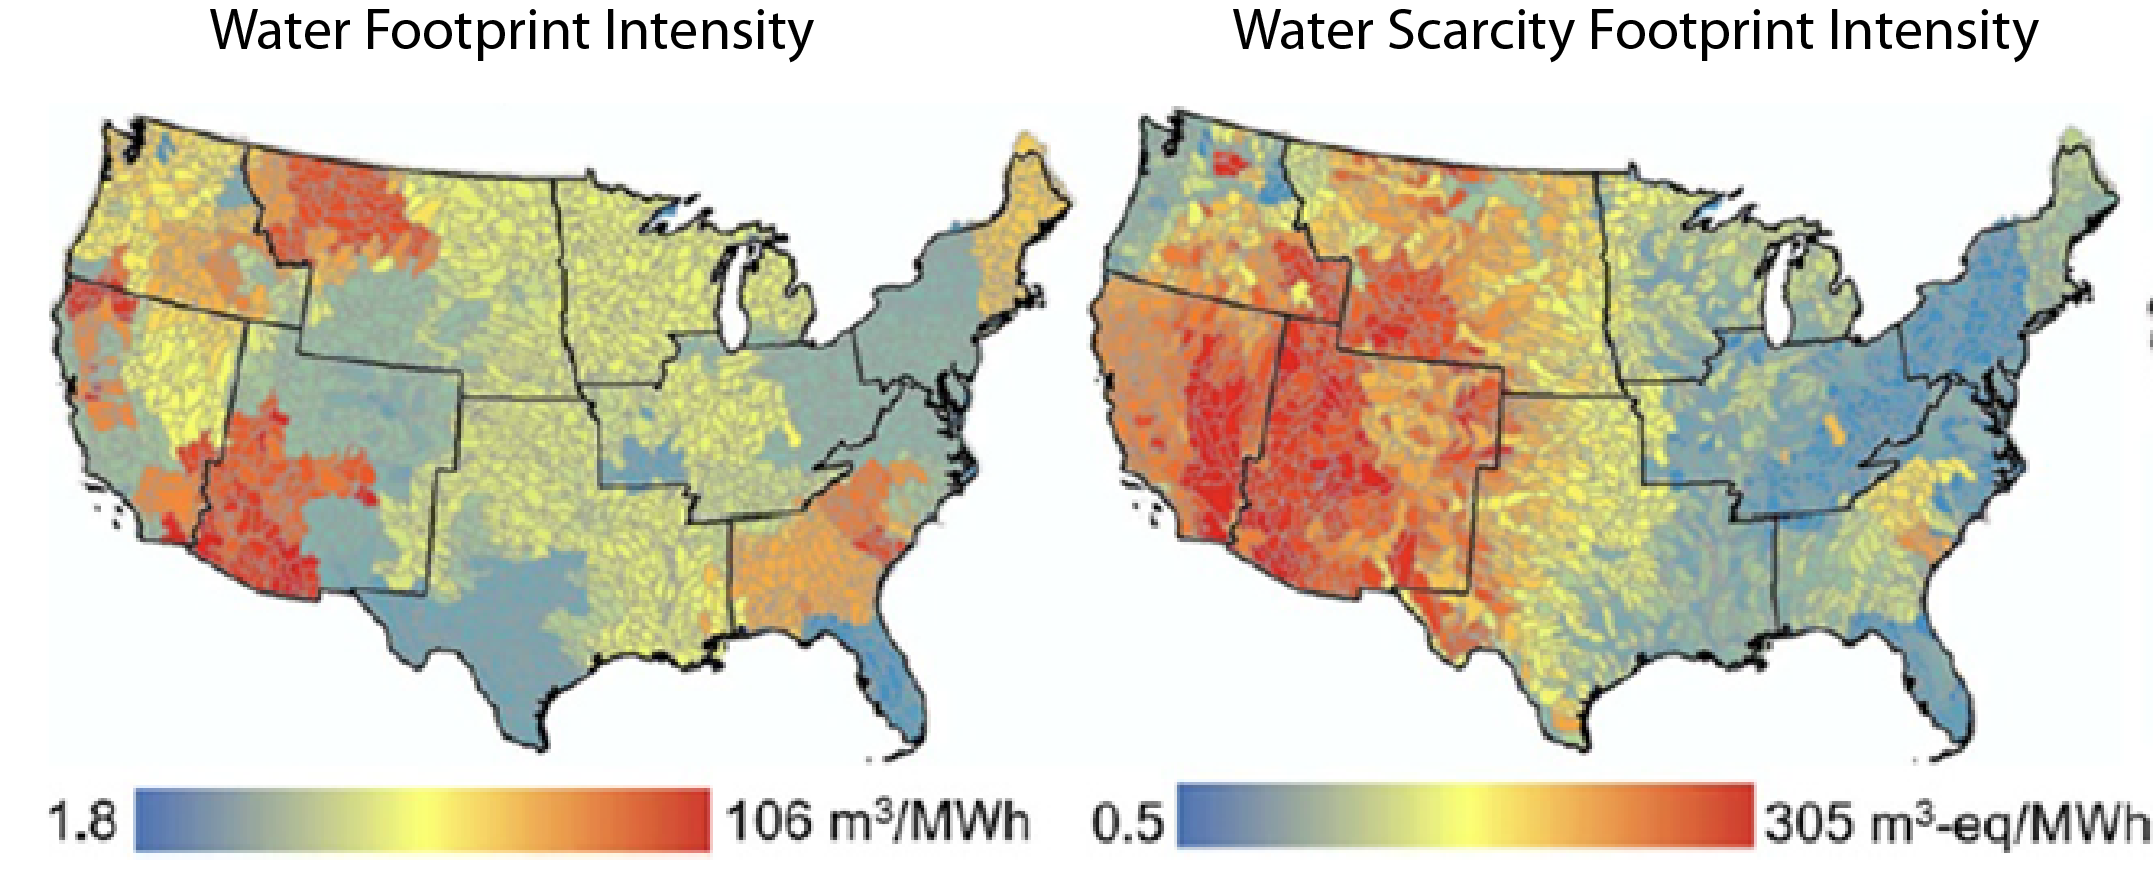
- Total water footprint intensity and water scarcity footprint vary spatially in the US with the latter highest in the SW US (Fig. 9).
- The water scarcity footprint intensity is highest in the Western US.
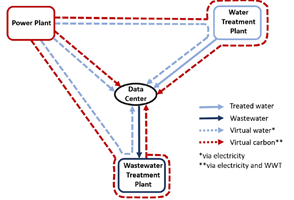
- Components of data centers (Fig. 6; Siddik et al., ERL, 2021):
- Power plant sending electricity to the data center
- Water treatment plant sending water
- Wastewater leaving the data center
- Water use for cooling the power plants that supply electricity to the data center varies with fuel type (fossil fuel: coal, natural gas etc, renewable, solar, wind) and cooling system (water cooling, air cooling) (Source: Energy Information Agency)
- Water consumption for data centers in 2018 (direct and indirect): 0.51 km3 (0.42 maf)
- US water consumption in ~ 2010 – 2012: 128 km3; data centers ~ 0.4% of US consumption in 2018
- Water withdrawal for data centers: 0.6 km3 (2018), compared to 445 km3 in US in 2015; data centers ~ 0.1% of US water withdrawal
- Direct water consumption at the data center to dissipate heat = ~ 25% of total water consumption on average
Indirect water consumption related to electricity from the grid = ~ 75% of total water consumption on average
- Water scarcity footprint (WSFi): water scarcity in the region based on the AWARE method (Boulay et al., 2018)
WSFi, Water scarcity footprint for subbasin I, CF characterization factor; normalizes WF against national average water availability after all water demands are satisfied, AMD = difference between water availability per area and water demand per area in subbasin i, HWC, human water consumption and EWR, environmental water requirements.
- Water scarcity footprint (WSFi): water scarcity in the region based on the AWARE method (Boulay et al., 2018)
- Data centers in the southwestern US located where water scarcity footprint is high
- Interest in locating data centers next to power plants with energy transmission etc.
- Tradeoffs between water, energy, and carbon
- Water cooled vs air cooled, latter has energy penalty and higher GHGs
- Putting data center water usage in context with other sectors:
- Google (2023), 29 billion liters withdrawn globally, 23 billion liters freshwater onsite cooling
- This is equivalent to water used to irrigation 3,000 acres of alfalfa in Arizona
- ~ 370,000 acres of alfalfa grown in Arizona
- Locally water use for data centers can account for 10 – 30% of total water use
- May need to invest in infrastructure

