Listen here on Spotify | Listen here on Apple Podcast
Episode released on January 15, 2026
Episode recorded on December 4, 2025
 Jürgen Kusche discusses advances in GRACE satellites, applications for flood monitoring, and data assimilation with global hydrology models.
Jürgen Kusche is a professor at the Institute of Geodesy and Geoinformation (IGG) at the University of Bonn in Germany. His research focuses on application of GRACE satellites to monitor the water cycle, emphasizing extreme events, especially flooding and understanding climate and land use drivers on water storage using data assimilation.
Highlights | Transcript
Jürgen Kusche heads up a working group with about 15 people who focus on applications of satellite data to improve our understanding of Earth and Ocean processes.
He is also affiliated with the DETECT (Disentangling the Role of Land Use and WaTer Management: Regional Climate Change) research center.
How GRACE Satellites Work
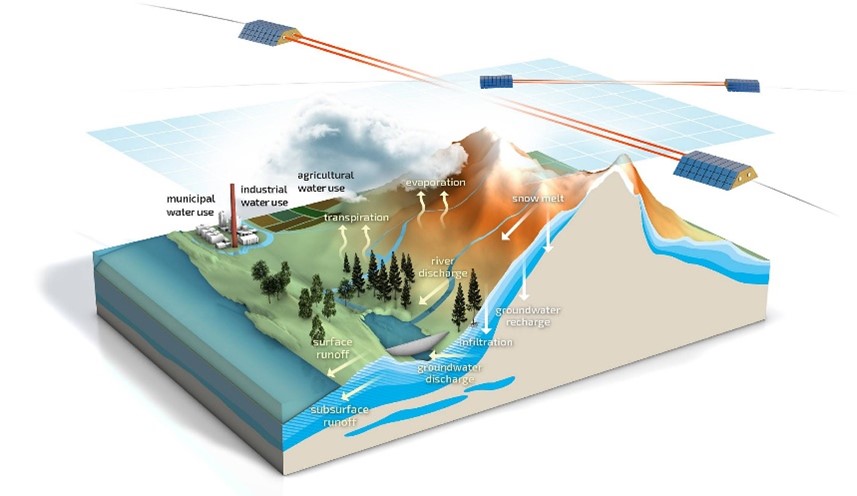
- Background on GRACE (Gravity Recovery and Climate Experiment) mission: monitors variations in gravity which change with water redistribution on Earth related to droughts and floods, glacier and ice sheet melting, etc.
- The gravitational acceleration at the Earth’s surface (~9.8 m/s2) is not constant, lower at mountain tops, and varies with changes in water mass (Fig. 1).
- Droughts and floods change the attraction of the gravity field and alter the movement of the satellites.
- GRACE consists of 2 satellites which chase each other (Tom and Jerry) nearly in the same orbit at ~490 km elevation (initial elevation of GRACE-Follow On). By monitoring the distance between the satellites, originally using a microwave ranging instrument (K Band Range [KBR] GRACE mission) and later including laser ranging interferometry (LRI, GRACE-Follow On mission, 2018 on), they can estimate changes in gravity which are translated to changes in water storage.
- Stronger gravity attracts the lead satellite, increasing the gap between the satellites, while weaker gravity slows the lead satellite, decreasing the gap, mapping Earth's gravity field and water movement over time (Fig. 1).
- The laser ranging interferometer (LRI) provides about 10–20× increased accuracy relative to the original microwave ranging instrument.
- Most satellites are restricted to monitoring the top few cm of the land surface (e.g., soil moisture sensors, etc.) but GRACE satellites are unique in monitoring water storage from the atmosphere into the deep subsurface.
GRACE Missions
There are a number of GRACE missions and also future missions:
a) GRACE Mission: Apr. 2002–Oct. 2017, polar orbit, monthly data
b) GRACE-Follow On (GRACE-FO) Mission: May 2018–present, polar orbit, monthly data
c) GRACE-Continuity Mission (GRACE-C) (NASA and DLR, Dec. 2028), polar orbit
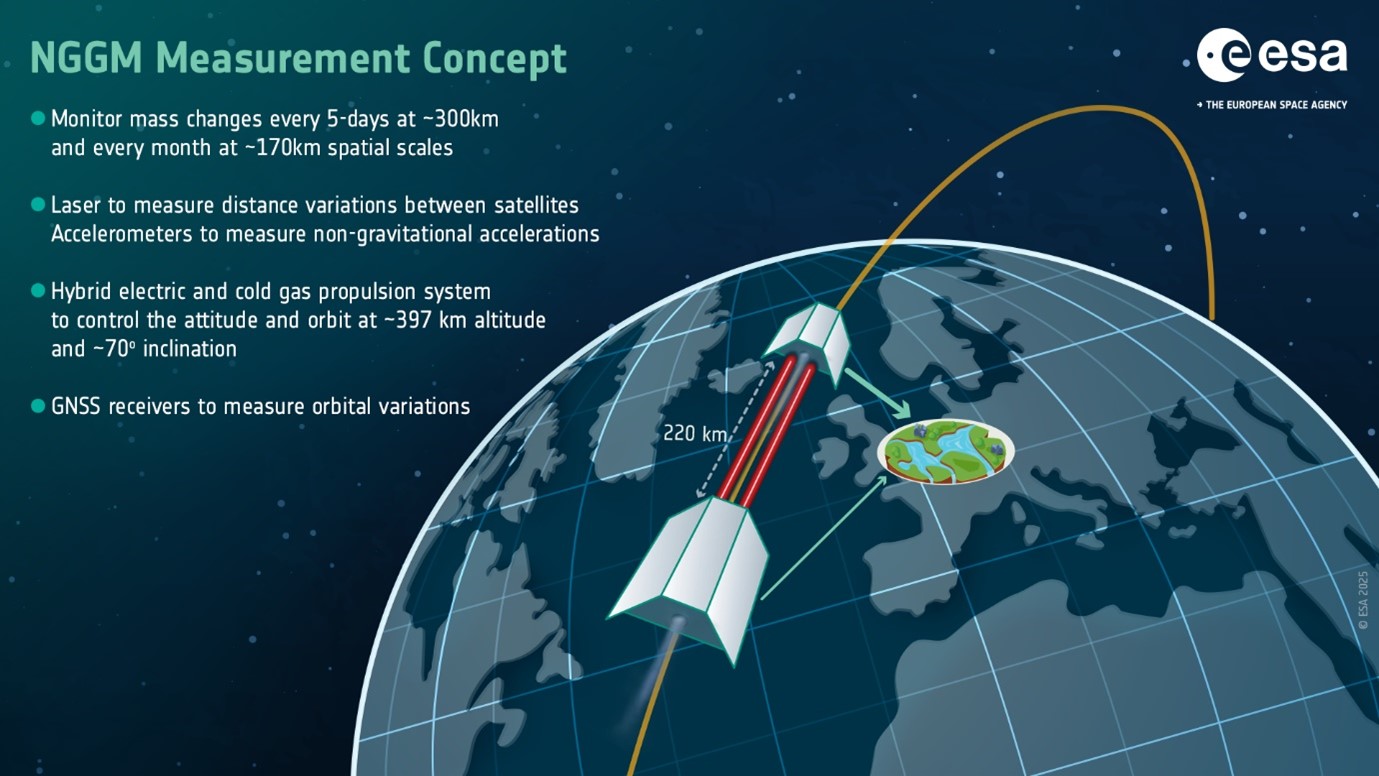
d) Next Generation Gravity Mission (NGGM) (European Space Agency [ESA], 2032), non-polar orbit, 400 km orbital elevation
e) Mass Change and Geosciences International Constellation (MAGIC) cooperation between NASA and ESA, includes four satellites (GRACE-C and NGGM) (Daras et al., GJI, 2024; Kusche et al., GJI, 2025)
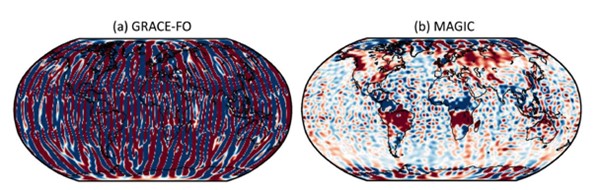
- NGGM, inclined orbit, ~70°, increased spatial resolution in the tropics relative to GRACE and GRACE-FO (Fig. 2).
- MAGIC, improved temporal coverage, ~5 day instead of monthly, reduced latency, currently 40–60 d down to a few days, should allow flooding to be monitored (Fig. 3) (Kusche et al., Geophys. J. Intl., 2025; Kusche et al., Satellite Gravity Missions and GEWEX, GEWEX Quart. 2025).
- SING (Studying the Impact of the NGGM and MAGIC Gravity missions), ESA assessment study headed by Magellium, evaluating the added value of the NGGM and MAGIC missions for scientific applications and operational services in hydrology, ocean sciences, glaciology, climate sciences, solid earth sciences, and geodesy through closed-loop simulations.
- Spatial resolution of GRACE and GRACE-FO is ~300 km (100,000 km2 basin) with ~2 cm uncertainty.
- Spatial resolution, temporal resolution, and accuracy occur within a trade space: optimizing one occurs at the expense of others (Wiese et al., Earth & Space Science, 2022).
- Increasing spatial resolution generally results in decreasing temporal resolution with same level of uncertainty.
- Recent analysis of seasonal cycles in water storage based on GRACE Level 1 B data show that spatial resolution could be reduced from 300 km to 12,500 km (O’Neill et al., AGU Fall Meeting, 2025).
- Providing GRACE data at sub-monthly (e.g., weekly, 5-day, or daily) resolution reduces spatial resolution because of decreased spatial sampling.
- 7-D temporal resolution may be achieved with same spatial resolution as GRACE-FO monthly solution when 2 missions are orbiting (MAGIC: GRACE-C and NGGM) (Fig. 4).
- To focus on a specific basin, can look at GRACE data as it is collected along the satellite orbit, local inversion.
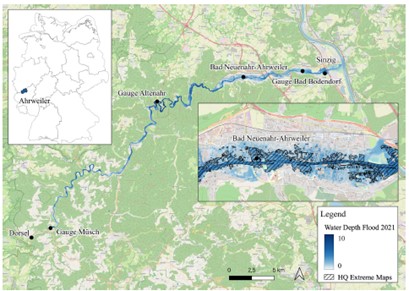
Flooding in Ahr Valley in Germany (30 km south of Bonn)
- Flooding in the Ahr Valley occurred in July 10–19, 2021 with a mortality of 134 (Fig. 5) (Roggenkamp et al., GPC, 2024).
- Flood hazard maps were outdated.
- No memory of flooding because previous large floods occurred in 1910 and 1804.
- Topography very steep, narrow valley. Main industries are tourism and wine.
- Extreme convective storm over 3 days, >150 mm rain over 72 hours, with peak water levels reconstructed to ~10.1 m. Gauges were destroyed or maximum measurable range exceeded.
- GRACE satellites did not fly over the flood.
- Precipitation forecasts from different products were quite variable.
- Can see atmospheric accumulation of water in the GRACE data.
- Likely ~1000 or more events of atmospheric accumulation seen annually in GRACE-FO data (Mielke et al., 2025).
- Analysis of the potential detectability of the flood using GRACE-FO based on Total Precipitable Water, Total Precipitation, and Total Water Storage indicates that they exceed the minimum LRI accuracy of 2 nm/s and would have been be detectable (Kracheletz et al., JGR Atmos., 2025).
- Normally atmospheric and oceanic signals are removed from GRACE data to focus on the land storages.
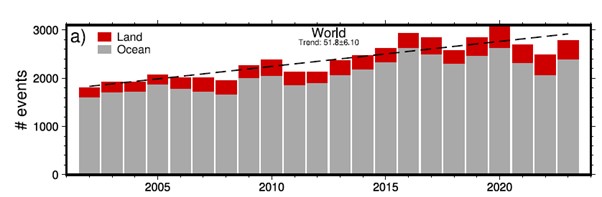
- Total Column Cloud Water (TCCW) events include atmospheric water vapor and liquid and frozen cloud water. Analysis of ERA 5 cloud water data indicates that there were >50,000 extreme events (≥0.6 km3) from 2002–2023 which can be detected with GRACE using the LRI. Most of these events occurred over the ocean (Fig. 6). These data can likely be used to improve meteorological models, which are typically good at representing water vapor but worse for cloud liquid and frozen water.
- TCCW events increased from 2002–2023 by ~50 events per year which is attributed to the rise in temperature (Mielke et al., 2025).
- GRACE data monitor all water storage components, snow and ice, soil moisture, reservoirs, groundwater, etc., and also atmospheric dry air and water vapor.
Groundwater storage in Germany impacted by droughts
- Strong droughts occurred in Germany in 2003 and in 2018 on.
- Droughts impacted transportation on the rivers, e.g., coal transports on the Rhine when natural gas imports from Russia were greatly reduced.
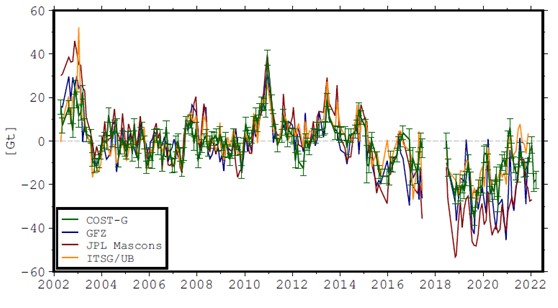
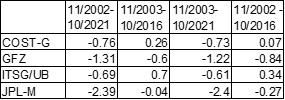
- GRACE data from JPL were used to estimate depletion over past 20 years similar to the volume of Lake Constance (~48 km3) equivalent to ~2.39 km3/yr (Nov. 2002–Oct. 2021) (Table 1).
- Andreas Güntner et al. used a variety of different GRACE solutions showing variations in trends depending on the solution and the time period considered (Güntner et al., 2022). COST-G merges datasets from seven international processing centers and results in 14.4 km3 of depletion (Nov. 2002–Oct. 2021), much lower than that estimated from JPL-M (Fig. 7, Table 1). This matched also closely the hydrological simulation with the TerrSysMP model (COSMO-EU-CLM-Parflow) from Stefan Kollet’s group, as shown in the Güntner et al. paper.
- The time period considered also impacts the TWS depletion, ranging over an order of magnitude for JPL-M for different time periods.
- Water storage depletion in Germany as inferred from GRACE data was impacted by signal leakage from melting glaciers in the Alps.
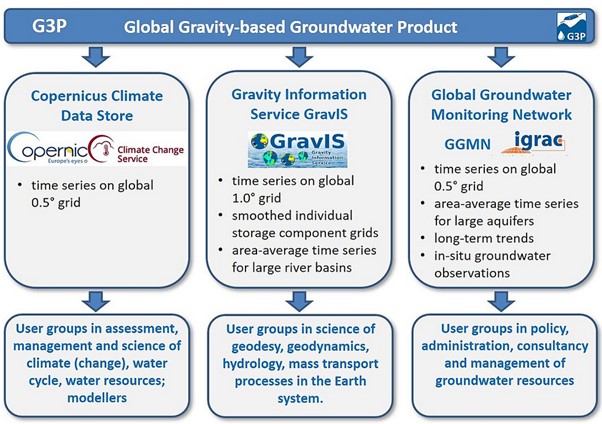
- A Global Gravity-based Groundwater Product (G3P) was developed within a European Union Horizon project (Fig. 8).
Data Assimilation using GRACE and WaterGAP Hydrological Model
- Data assimilation is used to integrate hydrologic models with GRACE data to improve the models.
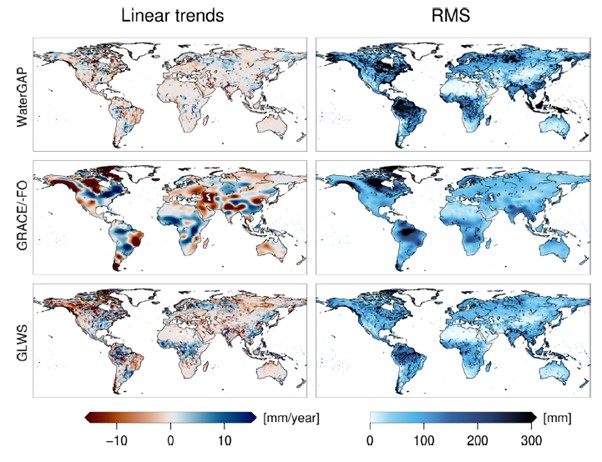
- A new Global Land Water Storage (GLWS 2.0, 0.5° resolution) data set was derived by assimilating monthly TWS anomalies from GRACE (-FO) into the WaterGAP global hydrology model using an ensemble Kalman filter (Gerdener et al., J. Geod., 2023) (Fig. 9).
- Map global wetting regions (P > ET) and drying regions (P < ET).
- Models from Coupled Model Intercomparison Project (CMIP) (IPCC framework) show large differences with GRACE data.
- Good correspondence between models and GRACE in the Mediterranean region.
- Poor correspondence among models and between models and GRACE in many other regions (e.g., Central and West Africa).
- Land use change also impacts the water cycle, changes the partitioning of water at the land surface among ET, runoff, and recharge.
- Agriculture in Eastern Europe changed markedly after the dissolution of the USSR and Eastern bloc, large collective farms transitioning to smaller farms. Countries in Eastern Europe experienced a massive reduction in irrigated area after 1990. It is the working hypothesis in the DETECT research center that these changes in land and water use affected the water cycle on a scale measurable today in drying and wetting patterns.
- Other land use changes: deforestation, reforestation, agroforestry, irrigation.
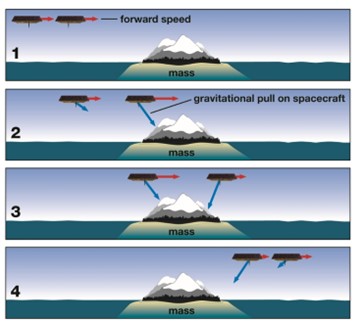
Panel 1: When both spacecraft are over the ocean, the distance between them is relatively constant.
Panel 2: When the leading spacecraft encounters land, the land's higher gravity pulls it away from the trailing spacecraft, which is still over water.
Panel 3: Once the second satellite also encounters the land, it too is pulled toward the higher mass and consequently toward the leading spacecraft. As the lead spacecraft moves past the denser land mass, it is pulled back slightly by the higher gravity of the land.
Panel 4: When both spacecraft are over water again, the trailing spacecraft is slowed by land before returning to its original distance behind the leading spacecraft.