Listen here on Spotify | Listen here on Apple Podcast
Episode released on December 11, 2025
Episode recorded on October 13, 2025
 Karen Guz is the Vice President of Conservation at San Antonio Water System. Her work focuses on conservation but this podcast provides a broader discussion on the portfolio of supply options to meet water demand projections in San Antonio and emphasizing droughts.
Highlights | Transcript
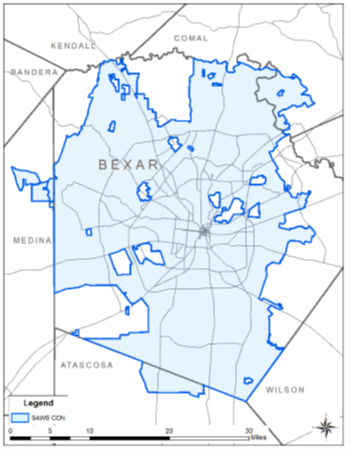
- The San Antonio Water System (SAWS) was created in May 1992 by consolidating three predecessor agencies (Fig. 1).
- San Antonio was 100% reliant on water from the Edwards Aquifer in 1995 when the population was ~ 1 million.
- The Edwards Aquifer is a karst aquifer that is very dynamic, responding rapidly to droughts.
- Endangered species issues requiring maintenance of spring flow led to a cap on how much Edwards Aquifer water the city could access.
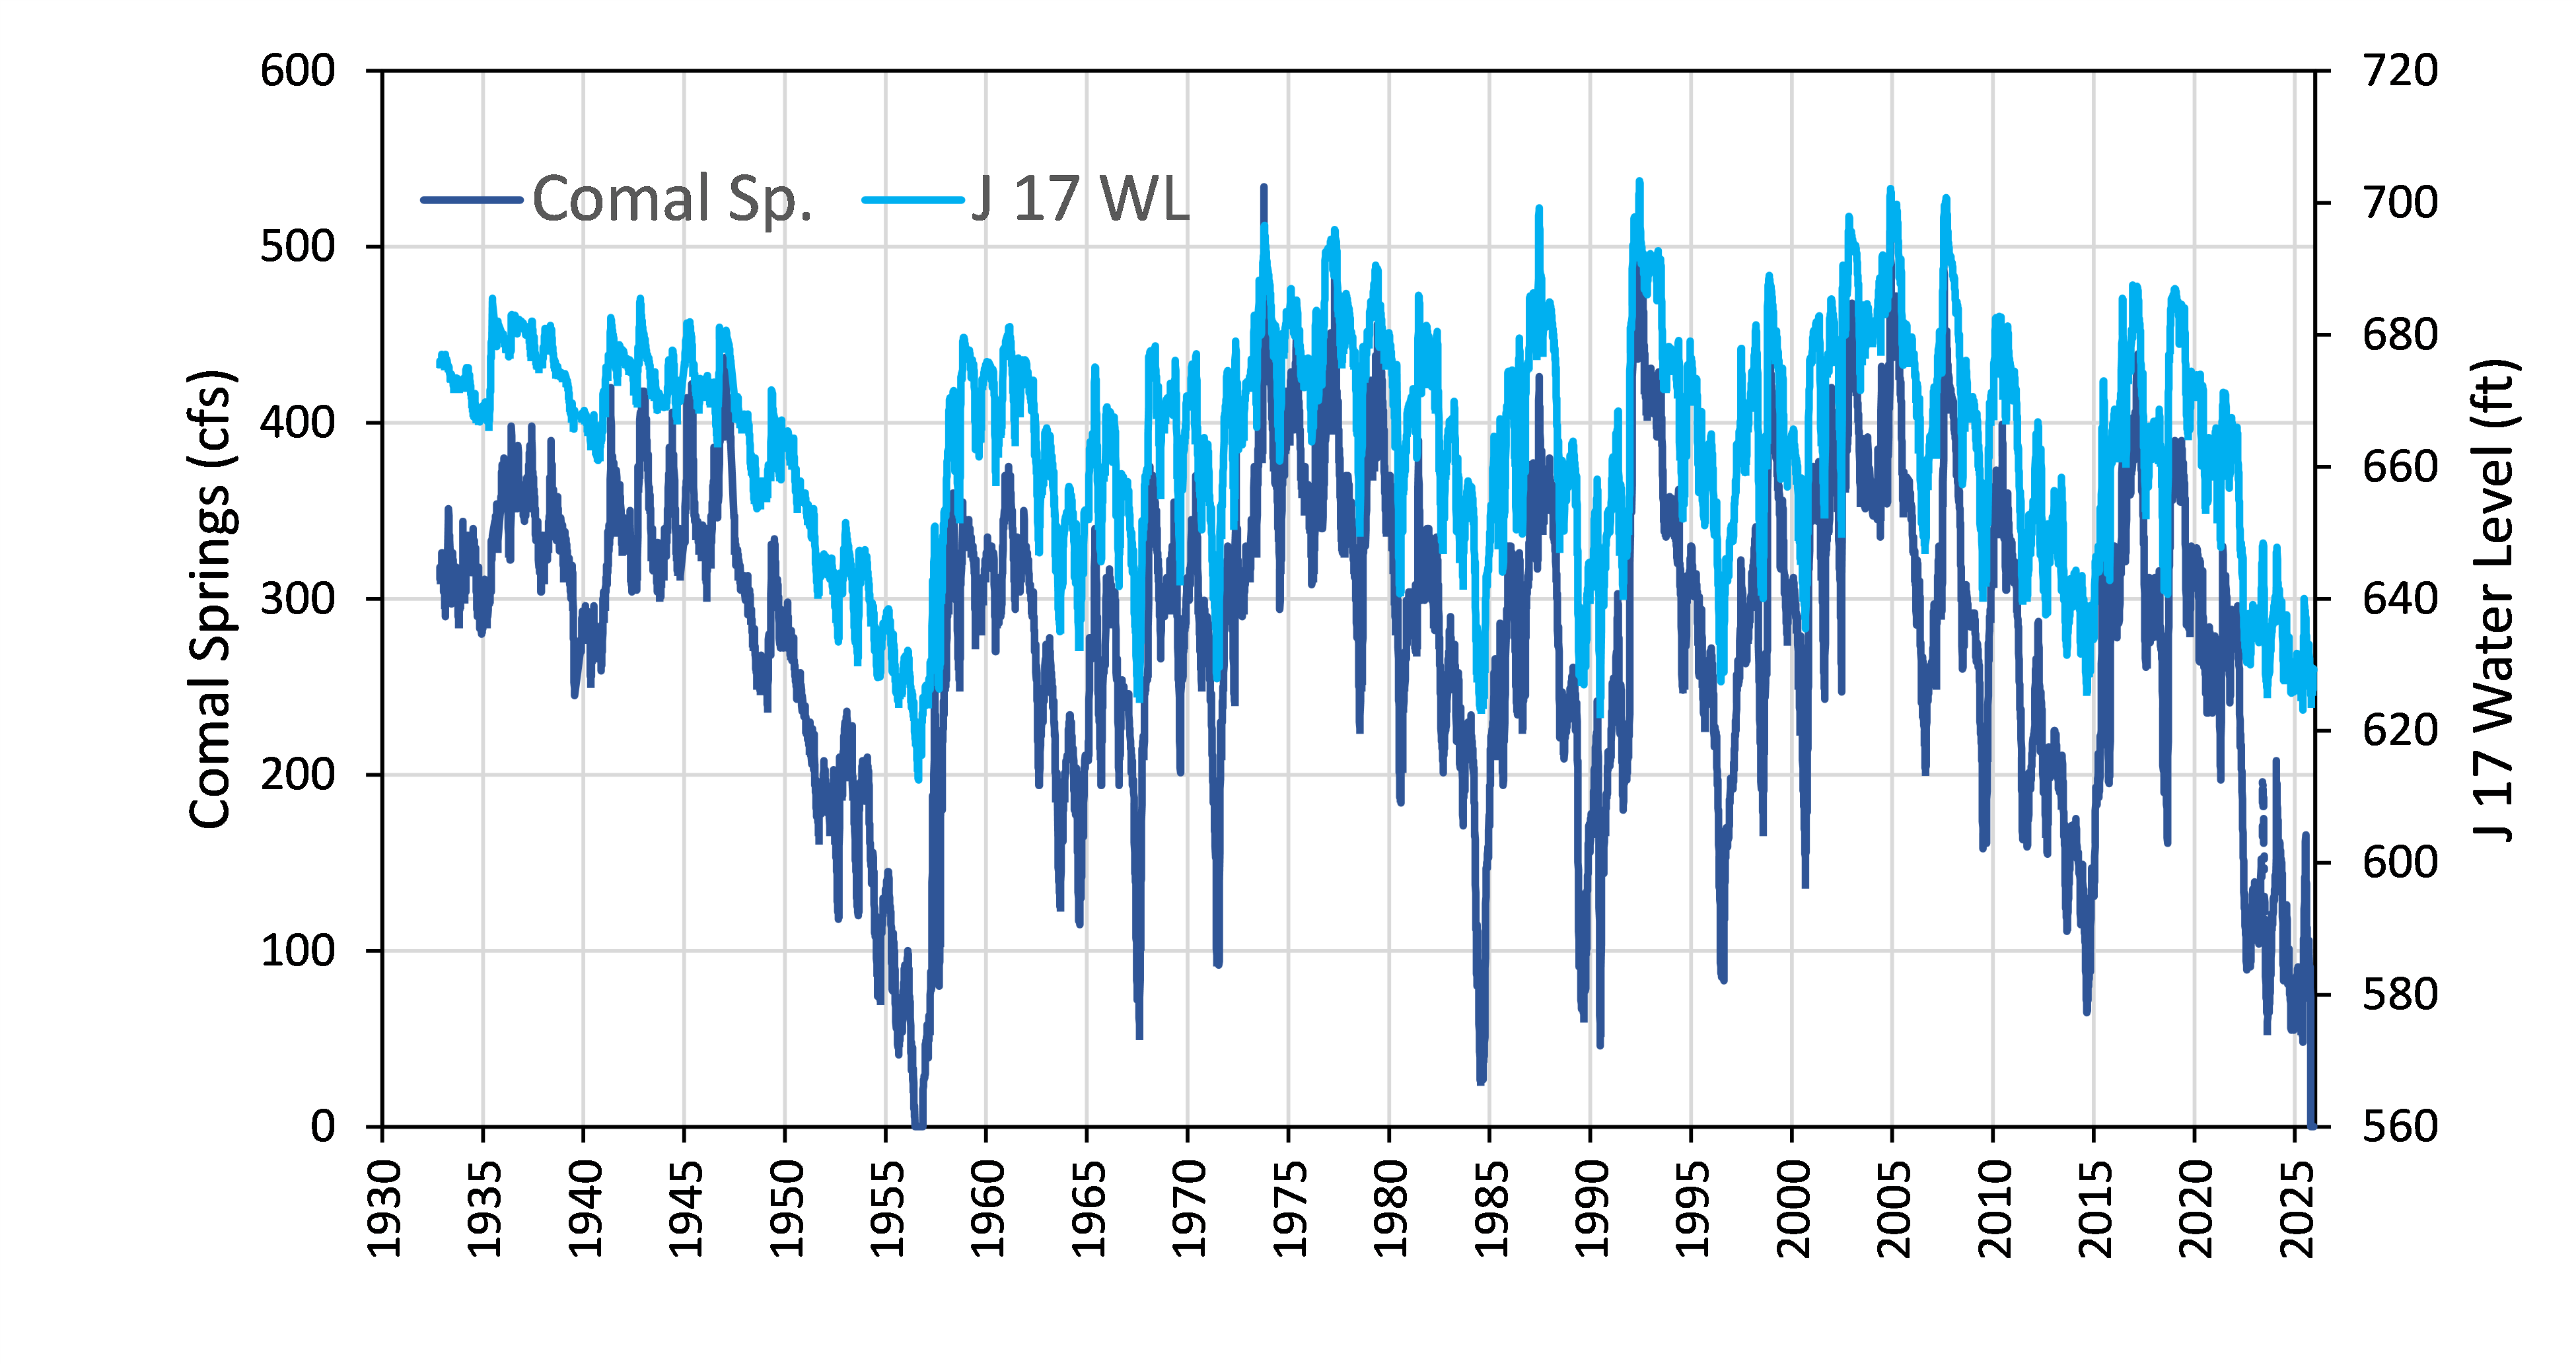
- The pumping limits vary depending on the aquifer levels as monitored in J-17 well (Fig. 2)
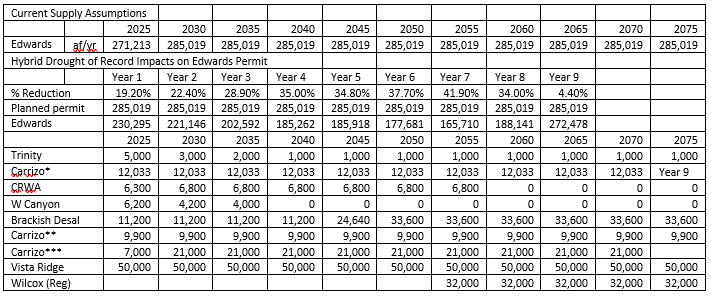
- When groundwater levels exceed 660 ft and no pumping limits are in place, SAWS can pump up to 281,000 af/yr with current permitted supplies
- EAA stages range from 1 – 5 with J-17 water levels declining from 660 ft to 625 ft above sea level (Stage 5)
- Pumping reductions are up to 44% for Stage 5
- Population served by SAWS increased from ~ 1 million in 1995 to 2.1 million in 2024 (SAWS 2025 Water Management Plan)
- San Antonio is among the top 10 most populous cities in the US and growing rapidly.
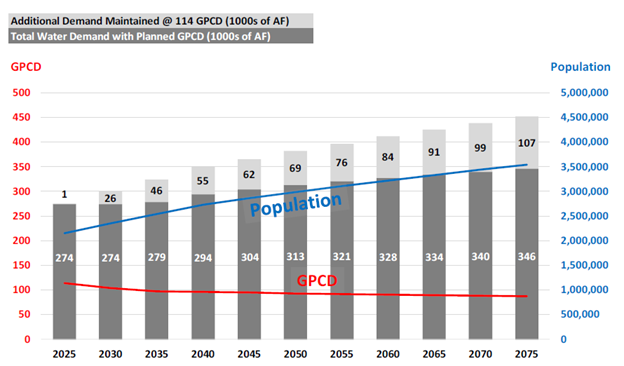
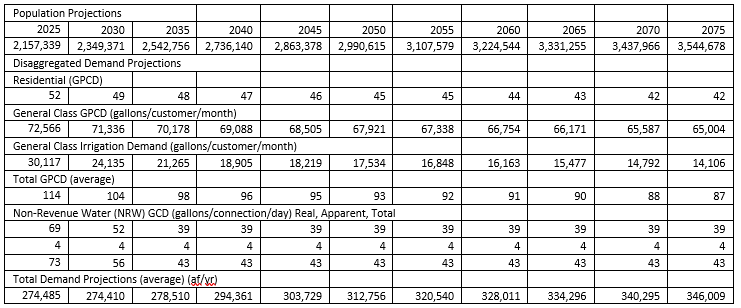
- SAWS service area population is projected to grow from 2.1 million (2024) to 3.5 million in 2075 (Fig. 3).
Water Demand Projections
- Water demand varies with population, gallons per capita per day (GPCD), and drought conditions
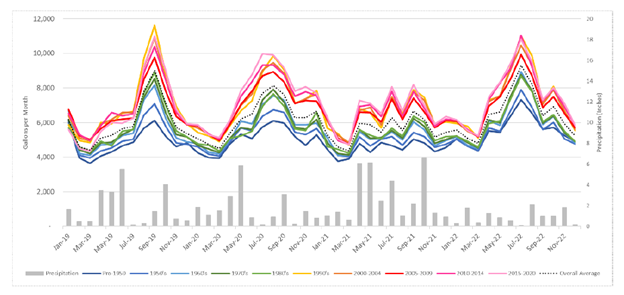
- Water demand is projected to increase from ~275,000 af/yr (2025) to 346,000 af/yr (2075) (Fig. 3, Table 1)
- The population is projected to increase from 2.1 million (2025) to 3.5 M (2040) (Fig. 3, Table 1)
- Near-term projections are more conservative and assume full migration whereas mid-term and long-term projections are less conservative to avoid overbuilding infrastructure.
- Water demand projections include population projections, GPCD projections, and water losses
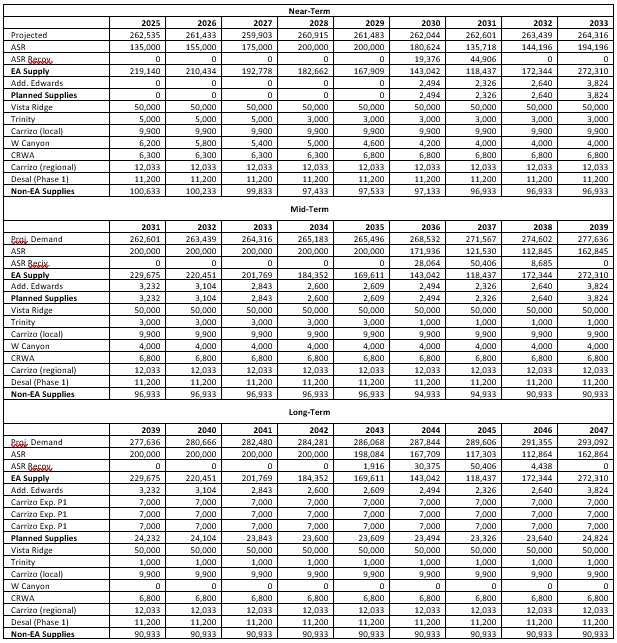
- Water demand projections are developed for near-term (2025 – 2033), mid-term (2034 – 2049), and long-term (2050 – 2075) periods and are updated every 5 years (Fig. 3, Table 3)
- Water demand is forecasted in terms of number of of accounts and usage per account in modeling
- Data centers represent small percentage of water use currently, possibly because they are located outside SAWS service area with less expensive land. Some data centers in the SAWS service area utilize recycled water, reducing the demand for potable water.
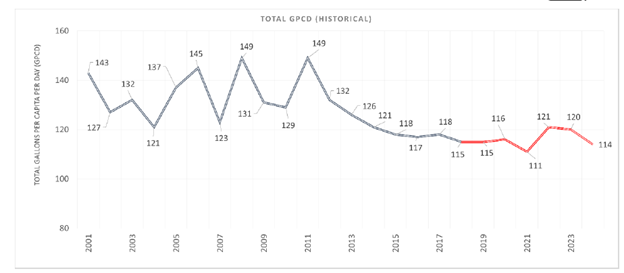
- GPCD values have decreased over time from 225 in 1982, 154 in 1992, to 116 (5 yr average, 2020 – 2024), 48% reduction (Fig. 4)
- GPCD is projected to decrease from 114 (2025) to 87 (2075) (Fig. 4, Table 1)
- Additional water needed if maintained original GPCD at 154 and multiplied by today’s population results in 90,000 af/yr, similar to almost two Vista Ridge projects
- Water loss is a big issue, with ~ 19.5 bgal (~60,000 af) in 2024 (San Antonio Express News) or GPCD losses from 18 in 2014 to 28 in 2023 (SAWS 2024 5 year Water Conservation Plan)
- Water losses linked to pipe breaks and drought. These losses represent non-revenue water.
- Water use varies seasonally from ~200 - 225 mgal/d in winter to 300-320 mgal/d in summer related to outdoor water use
Drought
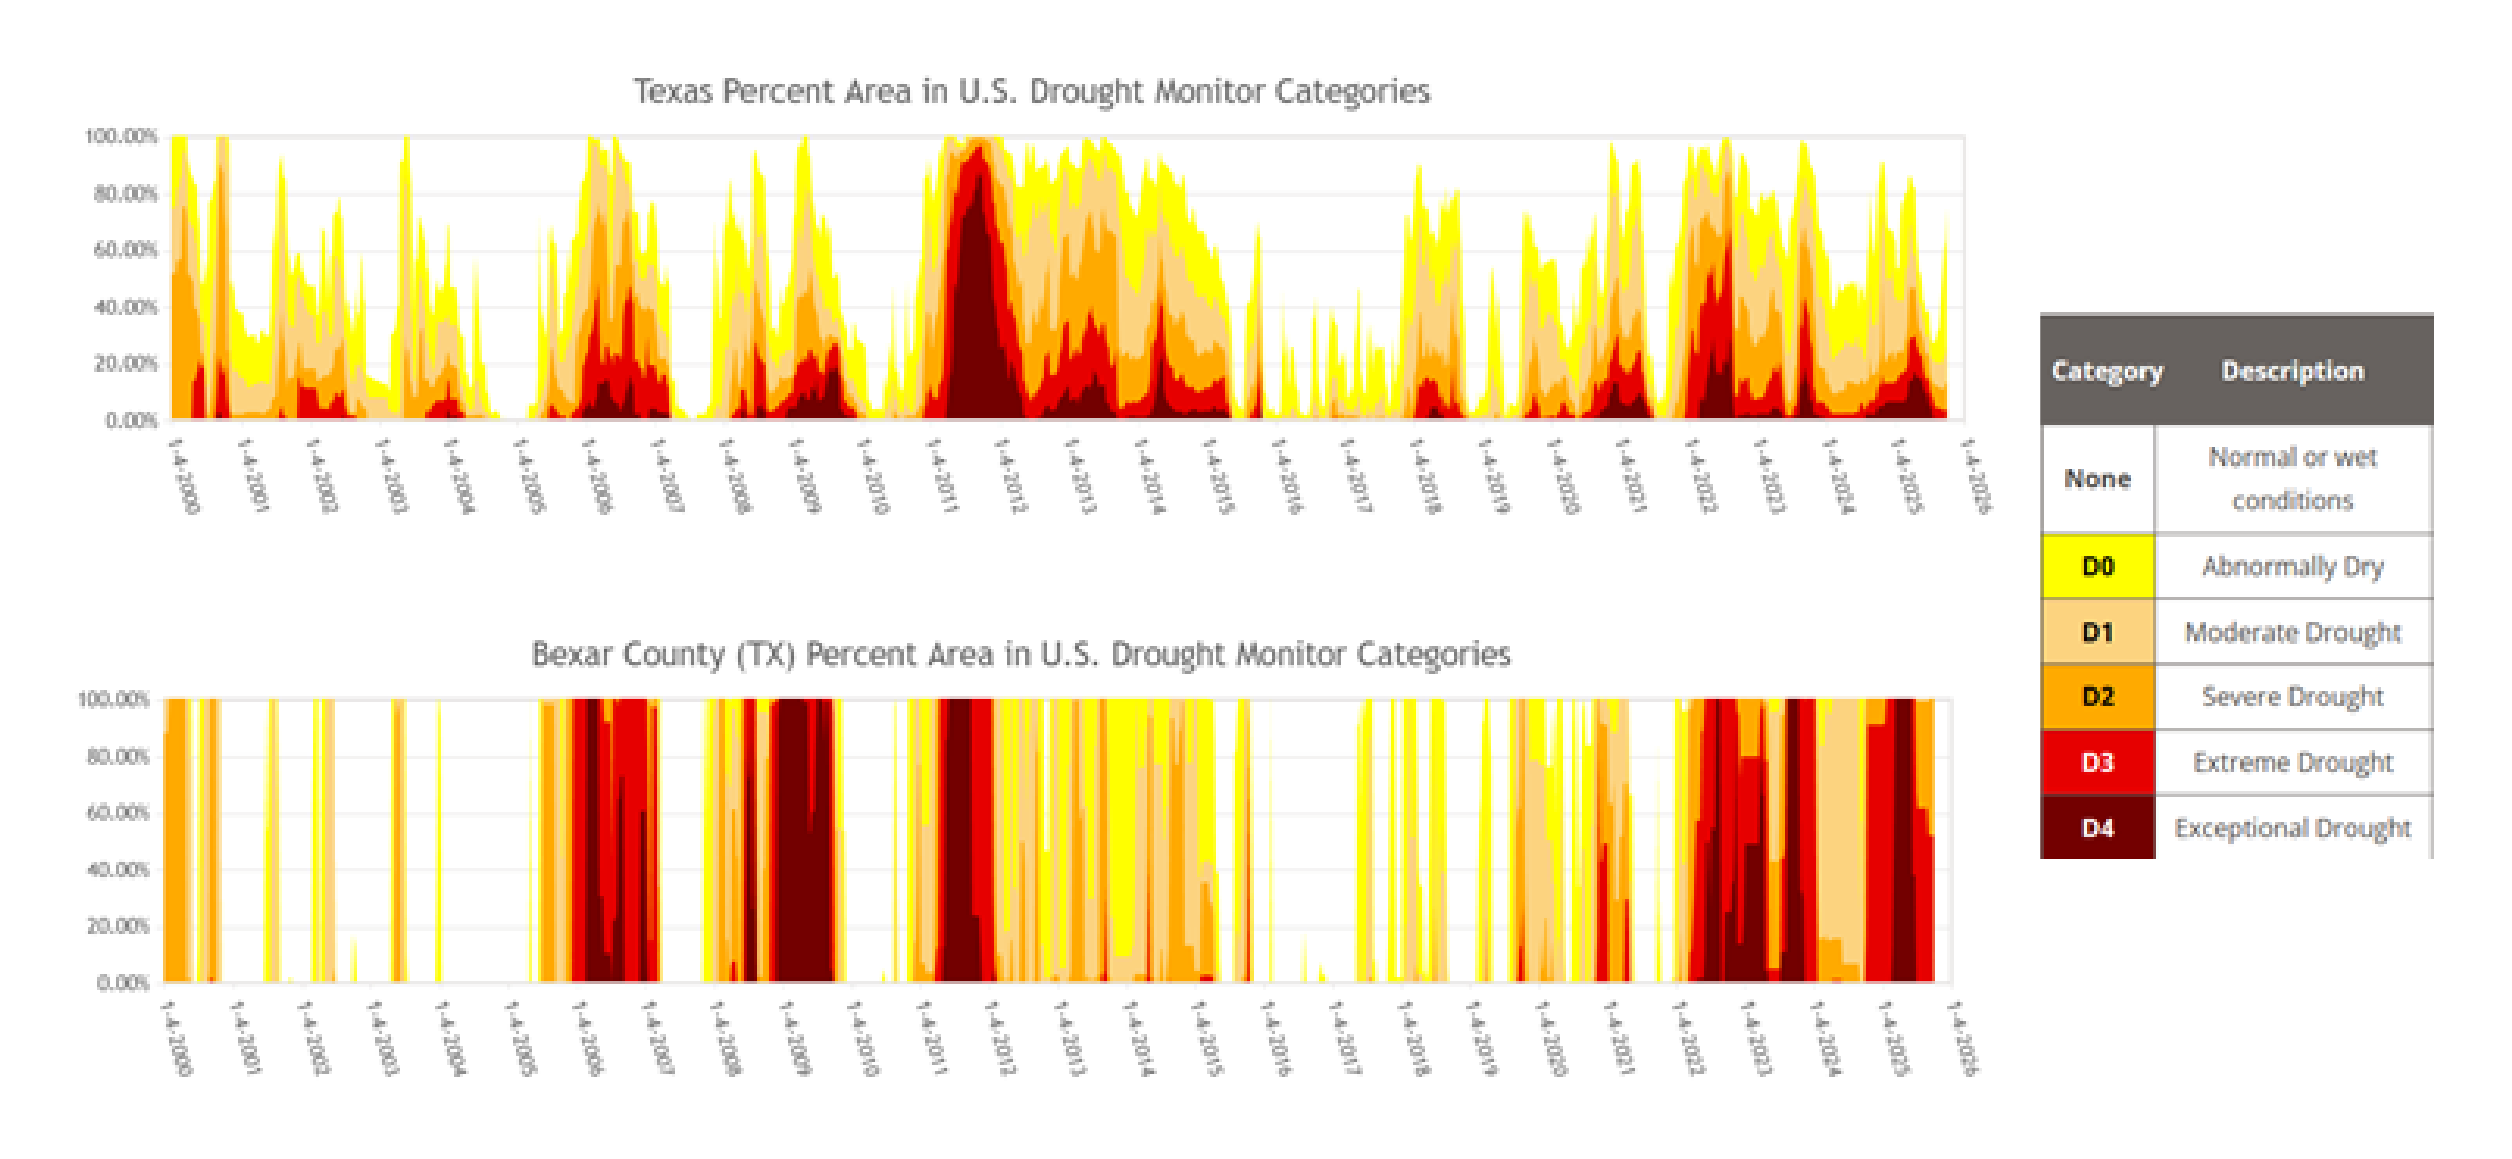
- Status of Edwards Aquifer reported on the news nightly, water level in J-17 well (Fig. 2)
- Texas drought 2011 – 2014; however, 2015 was one of the wettest years on record and included the Memorial Day floods in Wimberley (Fig. 5)
- Local drought conditions: Bexar County, encompassing San Antonio (Fig. 5), 50-inch water deficit built up over 6 yr period
- SAWS Water Plan: hybrid synthetic 9 -year drought, considers 1950s and 2011 – 2014 droughts with projected reductions in supplies up to 42% (Table 2)
- Currently in the 6th year of drought (2025), worst drought since the 1950s in duration and intensity
- Groundwater levels not as low as they were in the 6th year of the 1950s drought…even though population and industrial water demands are much higher now…reflects improved water management.
- J-17 and Comal Springs discharge shows impact of rain events (Fig. 2).
Water Conservation (SAWS 2024 5-year Water Conservation Plan)
- Strategies used to reduce GPCD:
- Education
- Incentives
- Regulation, reasonable regulation
- Conservation: replacing high flow fixtures early years (toilets, faucets, aerators, showers, spray valves)
- EPA water sense standard fixtures mandated in 2007
- Water softeners account for ~ 12% of indoor water use in homes and also environmental problems from salt concentrate.
- Achieved low water use in the 40s gpcd for indoor single family
- Older homes have similar indoor water use to newer homes because most fixtures replaced.
- Outdoor water use can be up to 70% of total water use in homes.
- Homes built in 1950s through 1980s generally did not have automatic irrigation systems (Fig. 6)
- Homes built in the late 1990s and early 2000s began to have automatic irrigation systems (these homes use most water)
- San Antonio and then the State of Texas passed laws that Home Owners Associations cannot require someone to replace grass during a drought, which supersedes their bylaws
- San Antonio: homeowners not allowed to waste water or irrigate in the middle of the day
- SAWS has 25 part time people to enforce drought restrictions
- Newer homes more likely to have pools
- Resilient, living, water saving landscapes at homes and businesses use drought tolerant plants, reducing the need for supplemental irrigation and reducing overall water demand
- Data driven approaches, finding outliers, alerting customers to high water use
- SAWS uses Advanced Metering Infrastructure (AMI) through its ConnectH2O program, including smart meters to automate water use collection, detect leaks faster.
Diverse Portfolio to Increase Resilience of Water Resources
- SAWS deploys a variety of water management strategies to increase resilience (2024) (Fig. 6):
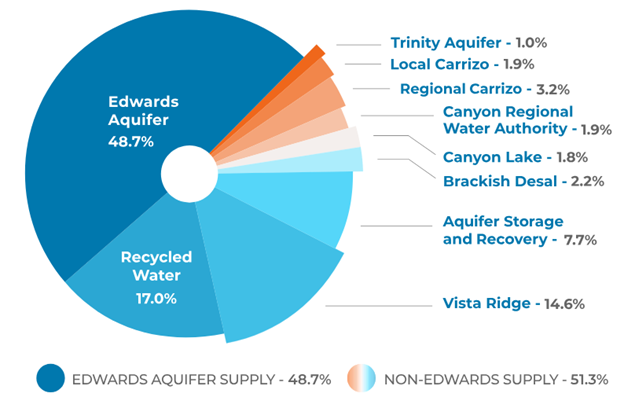
- 150 wells in the Edwards Aquifer (49% of water supply in 2024, 160,000 af)
- Aquifer Storage and Recovery (ASR, H2Oaks Center), store unused permitted Edwards Aquifer water in Carrizo Wilcox aquifer, including 29 injection/recovery wells. (3,500 af in 2024, 7.7%)
- Treated wastewater: 17,350 af (delivered to customers), 38,500 af (CPS Energy) 17% of water distributed
- Carrizo Wilcox aquifer (regional and local, 23,150 af, 5.1% in 2024).
- Canyon Regional Water Authority (1.9%)
- Canyon Lake (1.8%)
- Brackish groundwater desalination: in H2Oaks Center, includes 13 wells for production (11,200 af/yr) (2.2%)
- Recycled Water (2024): Direct recycled water (17,350 af), 38,500 af CPS Energy 17%)
- Interbasin transfer (Carrizo/Simsboro Aquifer, Vista Ridge project, 47,700 af, 14.6% in 2024)
- Trinity Aquifer: 3,300 af (1.0% in 2024)
- Brackish groundwater desalination, Trinity Aquifer: 7,100 af (2.2% in 2024)
- Managing water to ensure chemical compatibility to avoid scaling or descaling or iron issues etc is very important
- Water management is conducted by reducing demand (conservation), diversifying and increasing supplies, storing water (ASR), and transporting water (Vista Ridge etc).
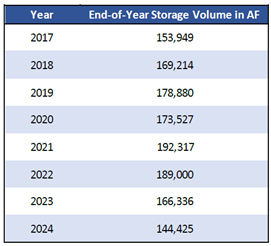
- Water stored in ASR has ranged from 154,000 af (2017) to 144,000 af (2024) (Fig. 7)
- SAWS managed three wastewater treatment plants and water recycling centers:
- Clouse: 125 mgal sewage/day;
- Leon: 46 mgal sewage
- Medio: 16 mgal sewage,
- Produces 125 af /yr of tertiary treated recycled water in a dry year (WW treatment capacity 225 mgd).
- Discharged to San Antonio River, Salado Creek, Leon Creek and Medio Creek.
- Purple pipe systems: 130 miles of pipelines to deliver treated recycled water to over 80 customers (SAWS 2025 Water Management Plan).
- The volume of wastewater did not increase substantially in the early decades because conservation was reducing the GPCD.
- Treated wastewater is used for:
- Cooling CPS Energy power plants
- Environmental flows through discharge to rivers to flow to bays and estuaries
- Purple pipe system for direct customer use (big volume customers)
- Windhoek in Namibia, sister city to San Antonio, one of first effluent to potable water treatment plants
- Stormwater: Pacific Institute report indicates about 50,000 – 100,000 af available in San Antonio
- Needs lot of treatment
- Edwards Aquifer recharge zone acts to capture stormwater
- Recharge enhancement features operated by the Edwards Aquifer Authority
- Landscaping can be done to enhance infiltration of stormwater (~ organic rainwater harvesting)
- Water markets: purchasing water from:
- Edwards Aquifer Authority
- Guadalupe Blanco River Authority
- VISPO: Voluntary Irrigation Suspension Program Option
- Projected water supplies increase from near-term, mid-term, to long-term planning phases (Table 3).
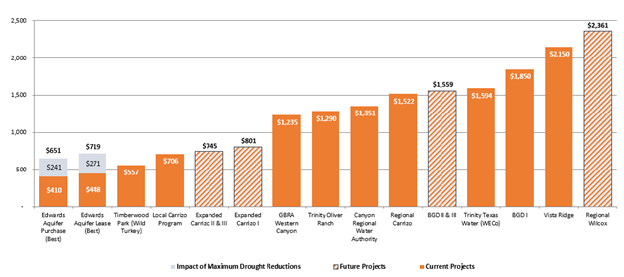
- The cost of new water supplies also increases (Fig. 8).