Listen here on Spotify | Listen here on Apple Podcast
Episode released on March 25, 2026
Episode recorded on February 5, 2026
 Dennis Lettenmaier discusses trends in snow, flooding, and drought in the Western U.S. with a focus on the Colorado River Basin.
Dennis Lettenmaier is a Distinguished Emeritus Professor at UCLA (joined 2014) and was previously a Professor at the University of Washington (1976–2014). His research focuses on hydrologic modeling and prediction, remote sensing, hydroclimate variability, and water management.
Highlights | Transcript
Colorado River Streamflow
Background
- Colorado River Basin: Upper Colorado River Basin (UCRB) accounts for ~90% of streamflow in the basin; therefore, most analyses focus on the UCRB (Fig. 1).
- Storage in Lakes Powell and Mead is ~4× the flow in the Colorado River.
- The basin has been subjected to long-term drought since 2000 (Post-Millennium Drought) (Fig. 2).
- Colorado River water allocations are being readjudicated in 2026.
Modeling Analyses
- Developed hydrologic simulations using the VIC (Variable Infiltration Capacity) model (Christensen et al., CC, 2004).
- Built a simplified reservoir model representing Lake Powell and Lake Mead storage, water deliveries (including Mexico), and hydropower production.
- Evaluated impacts of climate change based on CMIP3 model output used to force VIC simulation of the Colorado River Basin.
- Results show high sensitivity of reservoir system performance to altered (due to warming) inflows because system demands were only slightly less than long-term mean annual flow.
- Evaluated sensitivity of Colorado river runoff to precipitation:
- Fractional runoff change ≈ 2 × fractional precipitation change. For example: 6% precipitation decline → ~12% runoff decline.
- Climate Model Projections (CMIP3 vs. CMIP5) (Christensen and Lettenmaier, HESS, 2007)
- This study was motivated by a National Academies 2007 study Colorado River Basin Water Management: Evaluating and Adjusting to Hydroclimatic Variability of Colorado River Basin.
- Early CMIP3 projections suggested strong drying.
- Later CMIP5 projections showed less severe drying.
- Raised questions about downscaling approaches, model structural differences, interpretation of uncertainty.
- Runoff changes controlled primarily by increased ET.
- Follow-up study reviewed projections, indicating that most climate models projected declines by mid-century in the Colorado, but magnitudes vary from -40 to +20% (Vano et al., BAMS, 2012). Variations in projections result from:
- Choice of GCMs and scenarios (models vary by ±10%)
- Spatial resolution and topographic representation, 85% of Roff from 15% of area (high elevation headwaters), not captured in coarse resolution models (~ 200 km); Higher-resolution land surface and regional climate models generally produce: higher historical Roff and lower T sensitivity
- Land surface hydrology model differences:
- P elasticity (DRoff /DP): 2–3 at Lees Ferry
- T sensitivity: ~ -6.5%±2.5% per °C
- Statistical downscaling methods
- “On the Causes of Declining Colorado River Streamflows” (Xiao et al., WRR, 2018)
- Naturalized flow of the Colorado River decreased by ~16.5% (3.4 km3) over the past 100 yr (1916–2014) (Fig. 3a).
- Most of the flow is derived from subbasins with the Colorado River Basin (Fig. 3b).
- About half of the long-term trend is attributable to rising temperatures with the remaining related to changes in precipitation patterns, particularly in subbasins that yield large runoff in UCRB.
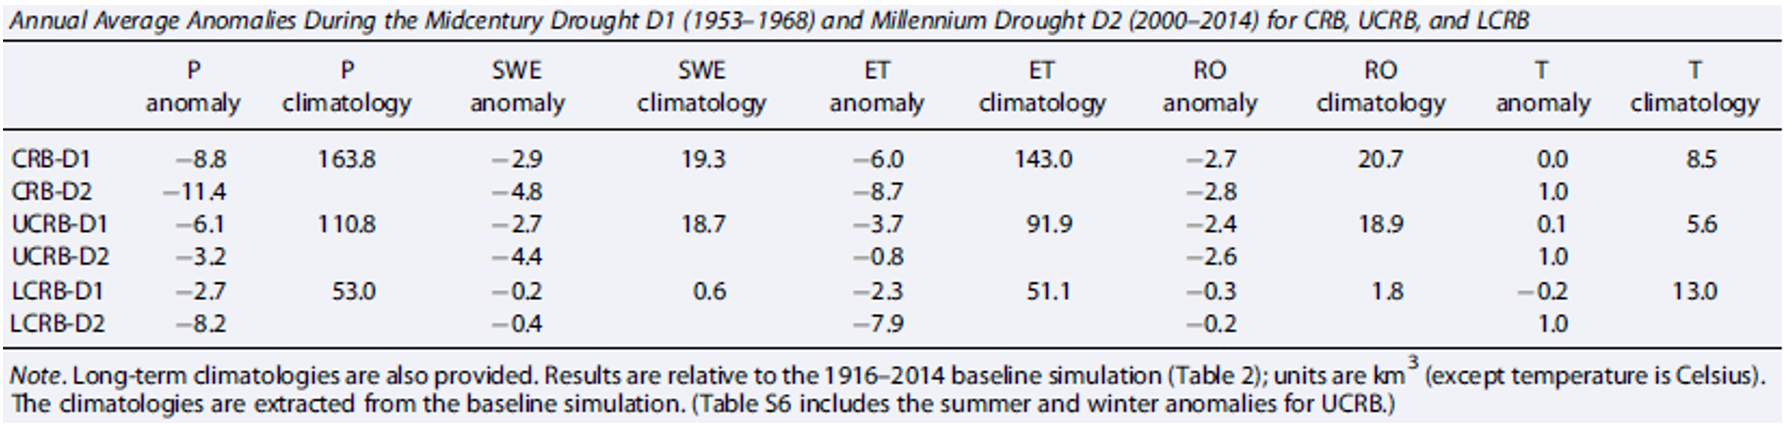
- Streamflow during post-Millennium Drought (after 2000) is related to anomalously warm temperatures (Table 1).
- The 1953–1968 drought is mostly related to reduced precipitation (Table 1) in contrast to post-Millenium Drought.
- Varying opinions about projected future of Colorado River flows: Milly and Dunne Science, (2020) versus Hoerling et al., JOC (2025).
- Milly and Dunne: radiation aware model: discharge declining by 9% per °C of warming because of increased ET, mostly driven by snow loss and decrease in reflection of solar radiation (aka albedo).
- Earlier snowmelt → darker surface exposed during high solar radiation. Leads to:
- Increased evaporation
- Reduced runoff
- VIC model estimates: ~5% flow decline per °C (VIC-based estimates)
- Hoerling et al. (2025) emphasizes the importance of precipitation as the primary driver of flow in the Colorado River.
- CMIP6 model precipitation and temperature used to simulate Colorado River flows for 2026–2050.
- P induced Lees Ferry flow changes range from -25 to +40%.
- Model projections conditioned on 2000–2020 drought suggest substantial water recovery.
- Climate Change Projections: Precipitation Uncertainty vs. Temperature Certainty
- Strong model agreement on warming trends
- Precipitation projections remain highly uncertain
- Decadal-scale variability remains significant
- Wet periods may still occur despite warming trend; could potentially get high precipitation periods within the next couple of decades.
- Lessons from 1983 Colorado River Flooding
- Kevin Fedarko “The Emerald Mile” describes the extreme high flows in spring 1983 that allowed Kenton Grua to go down the Colorado River (from Lees Ferry to Grand Wash Cliffs) in 37 hours because of large release from Lake Powell.
- Dam was damaged; blocks the size of Volkswagon cars from the dam; varying opinions of risk to the dam.
- Extreme late-season snowfall overwhelmed forecasts.
- April 1 snowpack regression models failed.
Snow’s Dominant Role in Western U.S. Hydrology
- Snow acts as natural seasonal reservoir, bridging gap between winter dominant precipitation and summer dominant water demand.
- “How much runoff originates as snow in the western United States?” (Li et al., GRL, 2017)
- 53% of total runoff in western U.S. originates as snowmelt, relative to 37% of P as snow (Fig. 4).
- Mountainous areas: snow = 70% of runoff
- By 2100, snowmelt contribution to Roff projected to decrease by a third (IPCC RCP8.5).
- Snowmelt currently = ~70% of major reservoir inflows
- Snow contributes:
~60%+ of runoff in Sierras & Cascades
Up to ~80% of runoff in interior West
- “Dramatic declines in snowpack in the western U.S.” (Mote et al., npj C&AS, 2018)
- Total western April 1 Snow Water Equivalent (SWE) declined by ~21% since 1915 = 36 km3 of water, exceeding the capacity of Lake Mead (32 km3) (Fig. 5).
- April 1 SWE is generally used as a proxy of total seasonal runoff potential.
- Earlier melt shifts runoff timing earlier in year (Stewart et al., Clim. Ch., 2004).
- Centroids of streamflow (CT) have shifted by up to > 20d earlier in many gauges from 1948–2000) (Fig. 6).
- Future projections under BAU suggest earlier rates consistent with observed rates (1948–2000).
- Earlier snowmelt is strongest in Pacific Northwest, Sierra Nevada, and Rocky Mountains, where many rivers eventually run 30–40 days earlier.
- Increasing T is the dominant driver of earlier snowmelt (Fig. 7).
- Snow drought: defined as snowpack (the amount of snow on the ground for that time of year) is much lower than normal (drought.gov).
- We are currently in a snow drought (2026), will below average SWE (Fig. 8), notwithstanding near-normal precipitation across much of the West.
- Many reservoirs in the West, such as Yakima River reservoirs had big floods in Dec. (2025), irrigation starts in ~April. Snowpack generally continues until June so reservoir management will be challenging in 2026.
- 2014–2015 snow drought: extended from Oregon in 2014 to Washington in 2015 (Mote et al., GRL, 2016)
- Over 80% of measurement sites west of 115W had record low snowpack in 2015 with a return period of 400–1000 yr for California snowpack (Fig. 9).
- Driver of snow drought: Oregon and Washington, sea surface temperature (SST) anomalies = 2 x human GHG influence
- 2023 Snow Deluge in California (Marshall et al., PNAS, 2024)
- 41 yr return interval for April 1 SWE in California
- Historical snow deluges occurred in 1983 (40 yr prior to 2023 deluge), 1969, 1952, 1938, and 1922 (Fig. 10).
- Snow deluges (20 yr April 1 SWE event) require both cool and dry conditions.
- Snow deluges projected to decline by 58% by late 2000s, whereas median snow years decline by 73%) but could potentially see some.
- Rain-on-Snow (ROS) Flood Trends
- Contrary to expectations, rain-on-snow floods decrease with warming because of less antecedent snowpack in warming climate.
- Runoff generated from ROS events is ≤10% of total extreme flood Roff in regions impacted by ROS (Li et al., WRR, 2019).
- Rainfall: dominant source of ROS in ROS events along the West Coast and over the W‐facing slopes of the Cascades and Sierra Nevada; Snowmelt dominant source of ROS runoff in the other regions in the CONUS.
- ROS increases in the future more likely in colder interior regions.
- “If Precipitation Extremes are Increasing, Why Aren’t Floods” (Sharma et al., WRR, 2018)
- Rising T à Extreme precipitation ↑ does not automatically mean floods ↑.
- Many studies indicate that the number and size of floods is unchanged.
- There are a number of Flood Generating Mechanisms (FGM) (Huang et al., GRL, 2022) (Fig. 11):
- Large scale frontal storms (Atmospheric and nonatmospheric rivers)
- Monsoons
- Convective storms
- Snowmelt
- Rain on snow
- Analysis of floods in 119 basins (1960–2018) show that:
- Floods related to convective storms increased
- Rain on snow floods decreased, attributed to less snow
- Snowmelt driven floods occurring earlier
- Other categories of flood generating mechanisms: no significant change in flood characteristics
- Disconnect between precipitation extremes and flooding attributed to decreases in antecedent soil moisture (Fig. 12), decreasing storm extent, and decreases in snowmelt (Sharma et al., WRR, 2018).
- “Slower snowmelt in a warmer world” (Musselman et al., NCC, 2017)
- Earlier snowmelt corresponds to less available radiation to melt snow.
- "Decelerating Response of Western U.S. Runoff to Shrinking Snowpacks” (Ban et al., GRL, 2025)
i. Runoff loss become less sensitive to warming as snowpack shrinks, related to reduced snowmelt‐radiation feedback, a consequence of smaller snow‐cover changes and shifts in snowmelt timing to lower‐energy periods.
National Water Model (NWM) vs. River Forecast Centers
- Hydrologic core: Noah-MP land model, hydrologically credible.
- NWM results for flood forecasts for California (2004–2023) were similar to those from the National Weather Service California–Nevada River Forecast Center (CNRFC) (Ma et al., J Hydrometeorol., 2026).
- Institutional inertia may slow operational adoption. SWOT Satellite Mission as a Hydrologic Breakthrough (Getirana et al., Nature Water, 2024)
- Surface Water and Ocean Topography (SWOT) launched in December, 2022
- Dennis Lettenmaier involved with SWOT mission since late 1990s
- Wide-swath altimeter (120 km band width) provides global coverage relative to traditional altimetry data.
- SWOT products include:
- SWOT Level-2 HR River Single Pass-Reach dataset: 10 km river reach providing average water surface elevation, width, and slop and pos-processed discharge estimates.
- Pixel Cloud (PIXC) ~20 m spacing along track and raster products at 100–250 m resolution
- Lakes and reservoirs ≥250 m wide
- Elevation accuracy: few cm at 1 km resolution
- Enables:
- Global surface water accounting
- Data assimilation into hydrodynamic models
- Represents major shift for hydrology similar to GRACE and SMAP.
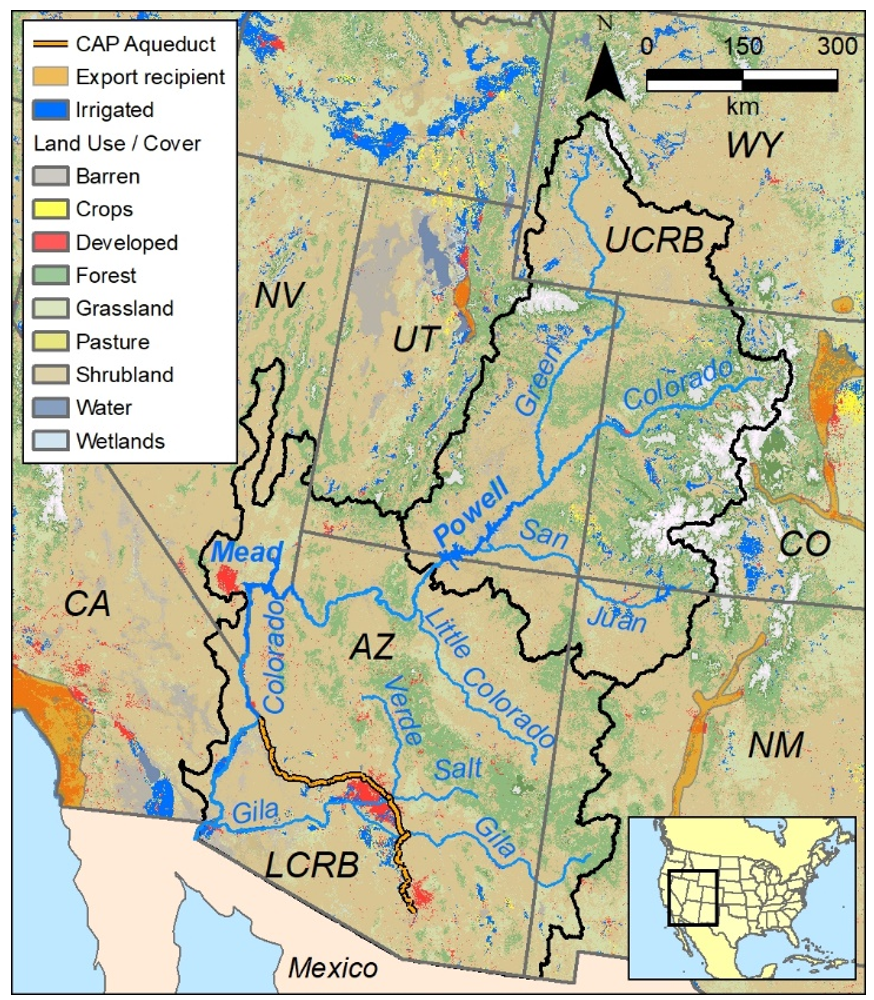
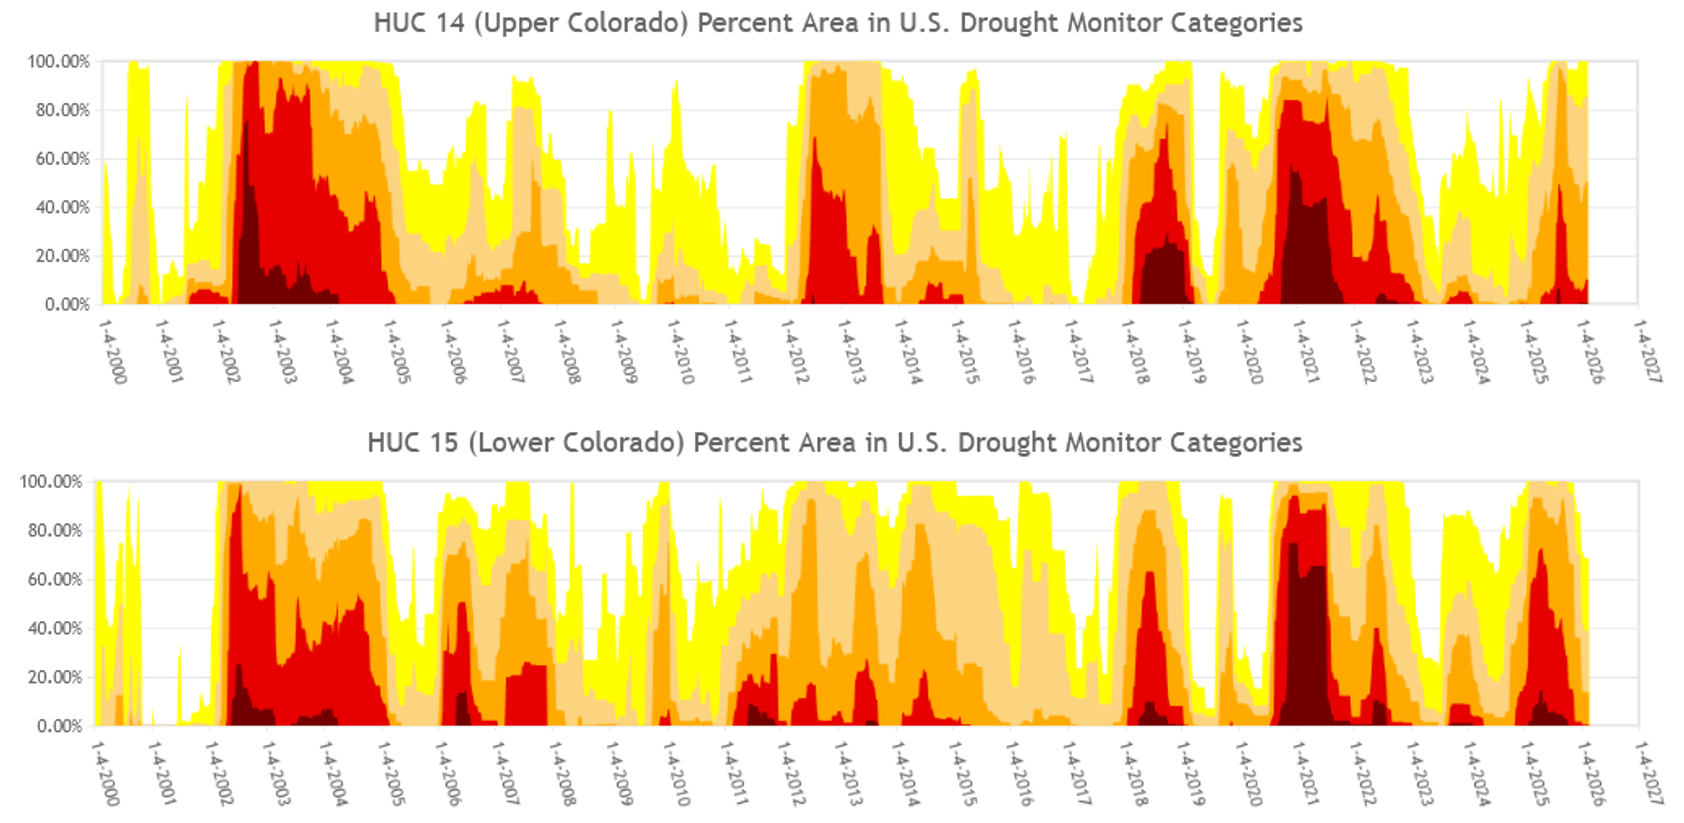
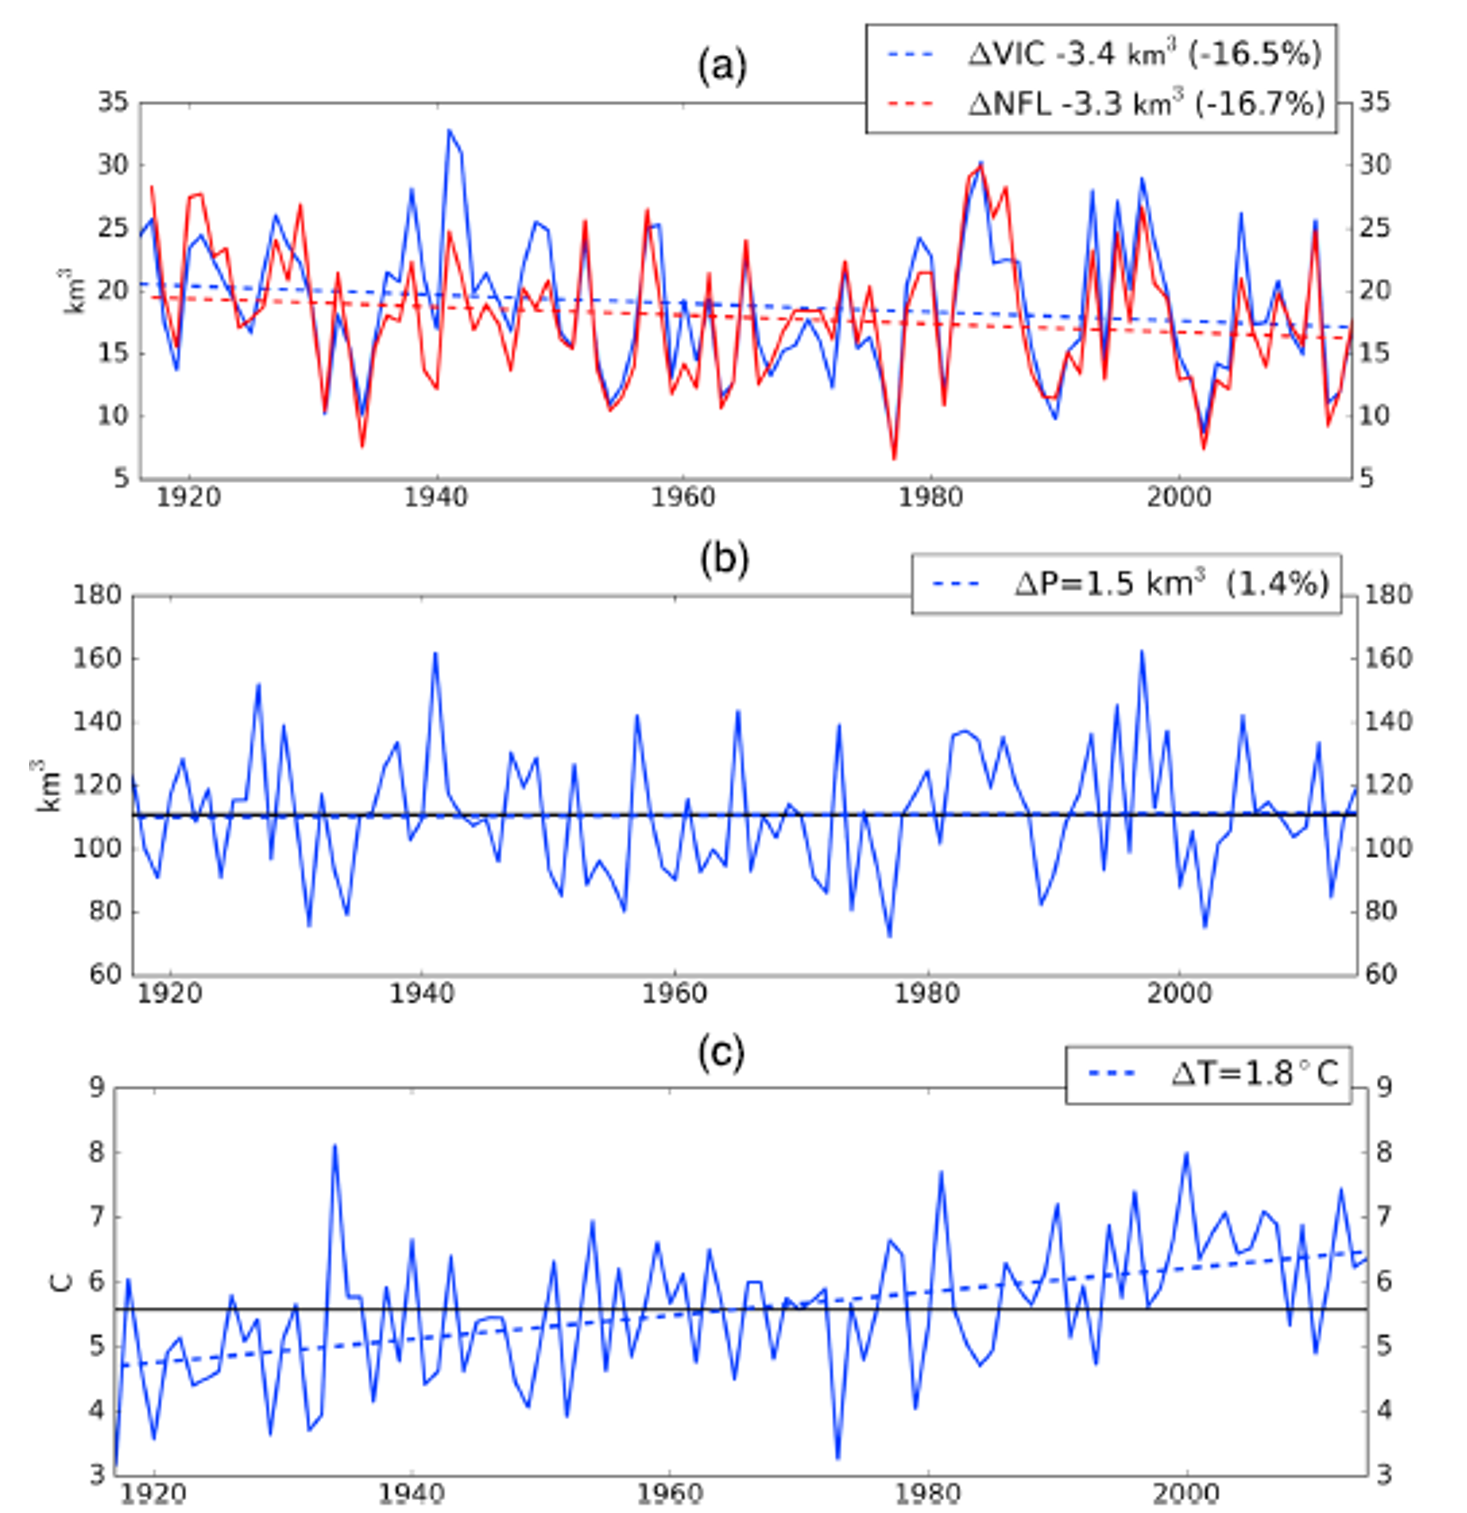
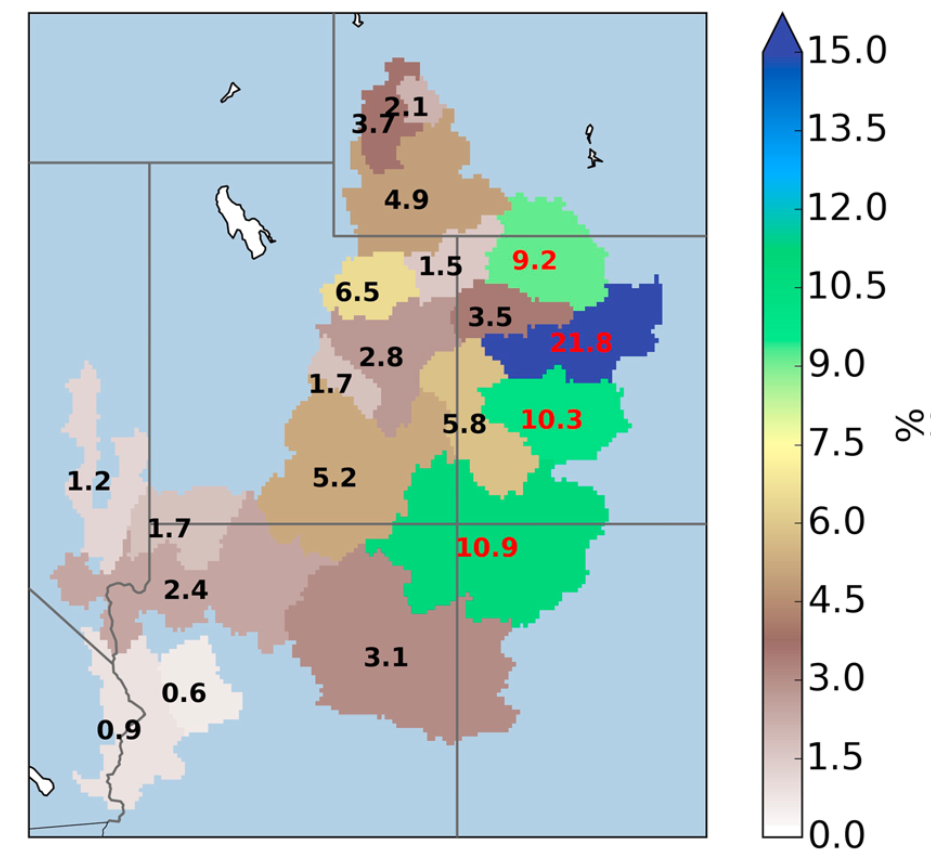
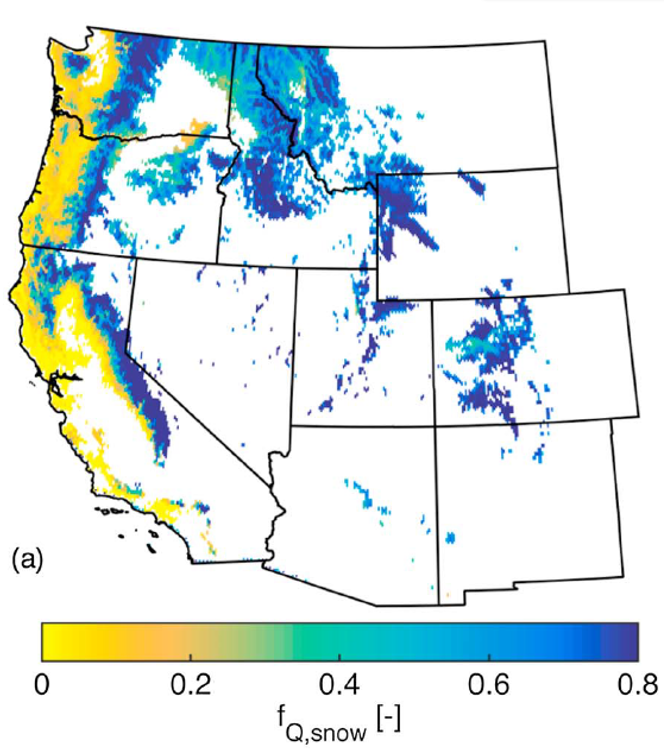
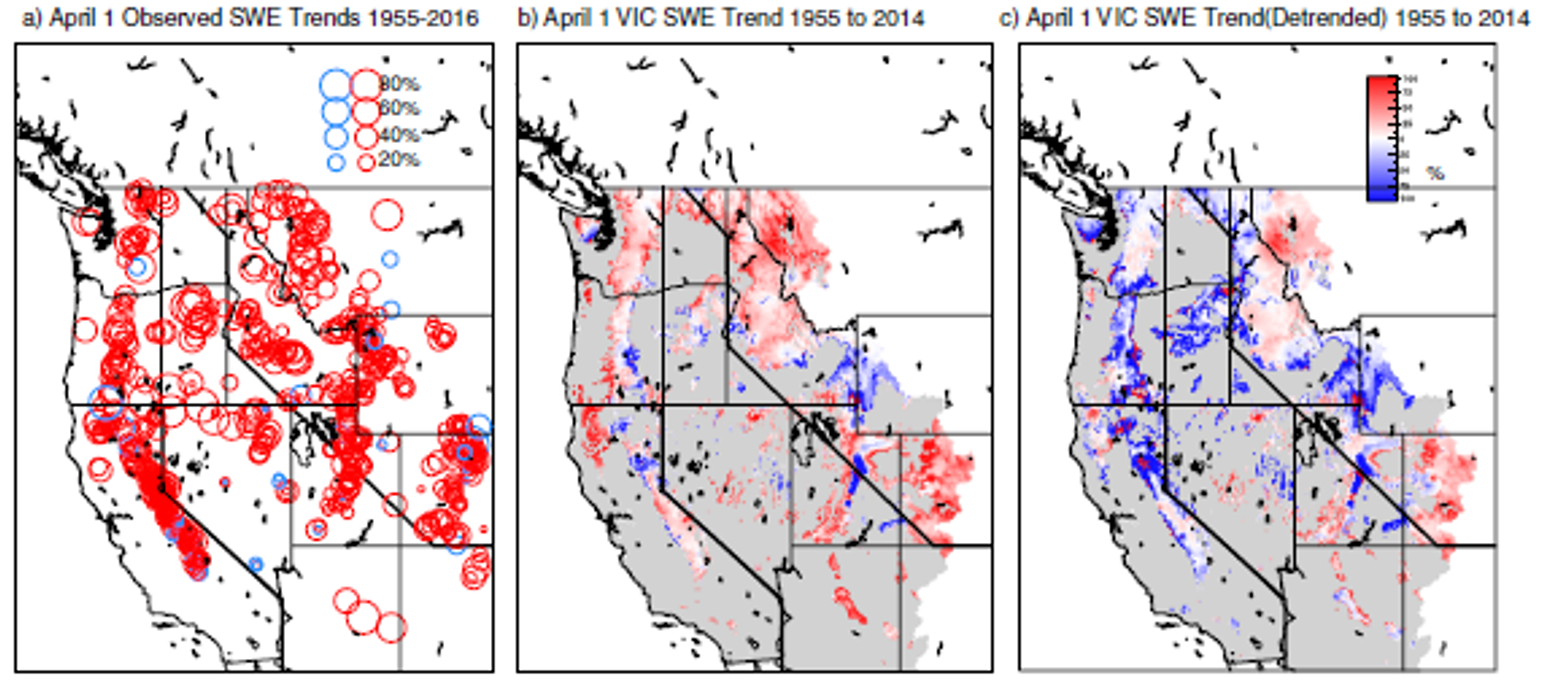
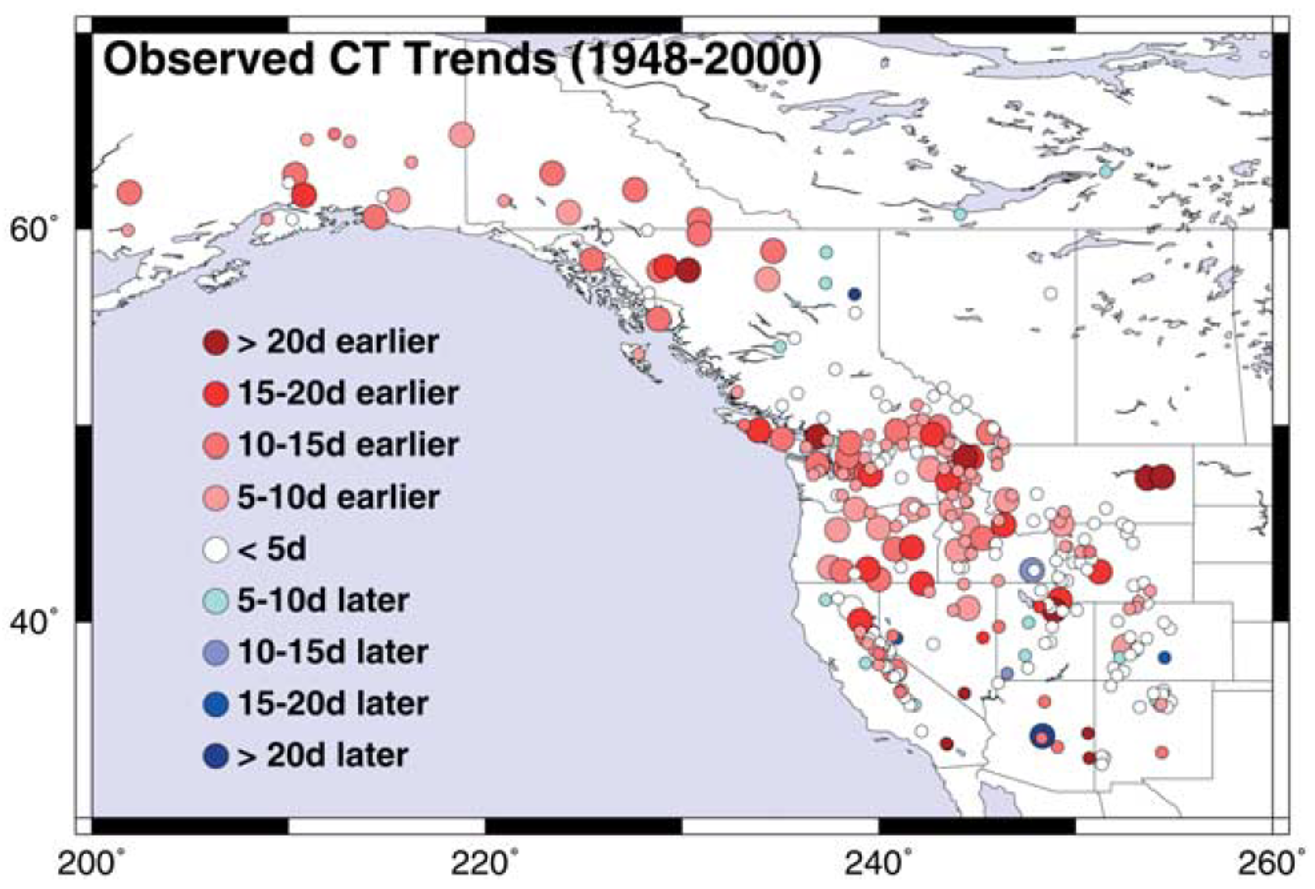
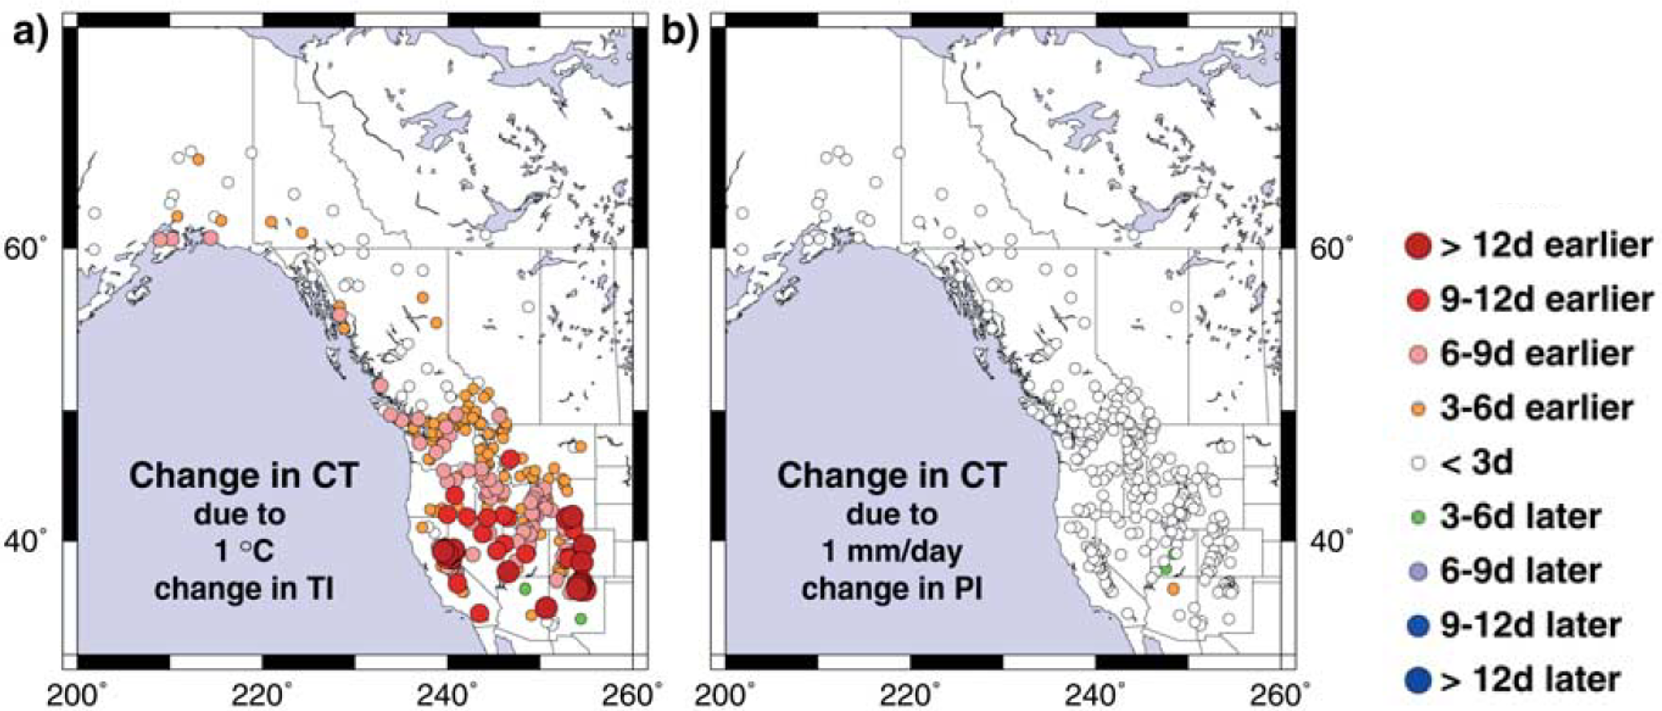
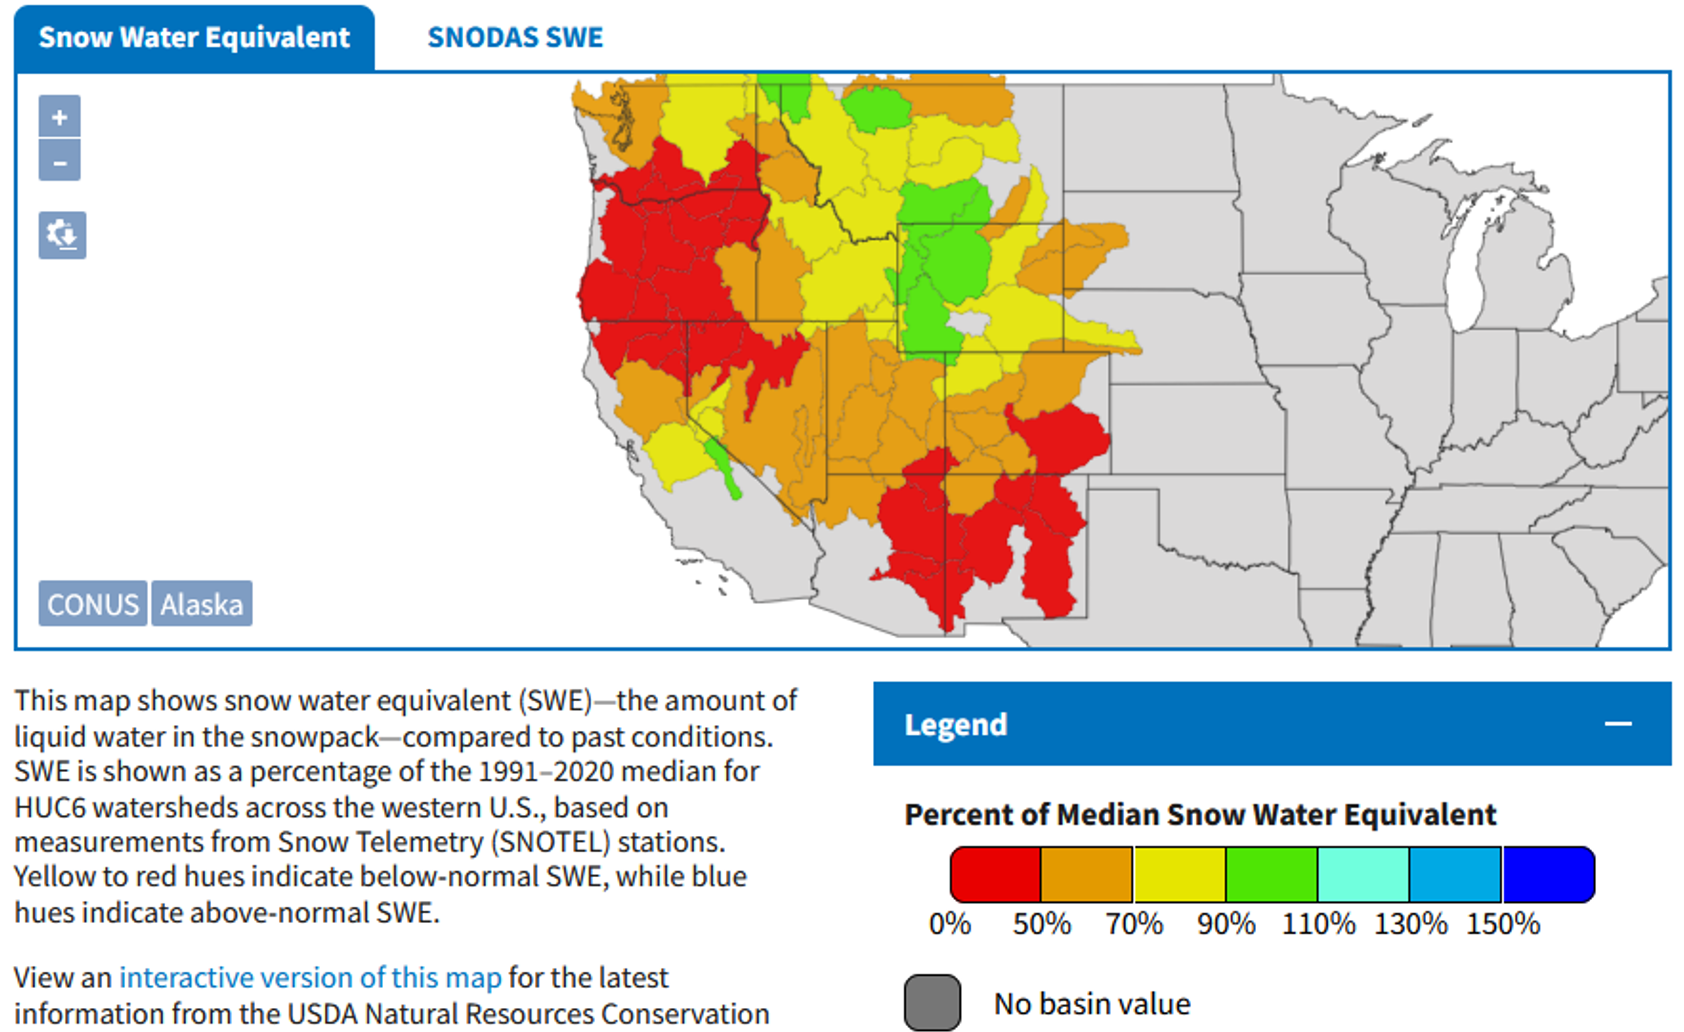
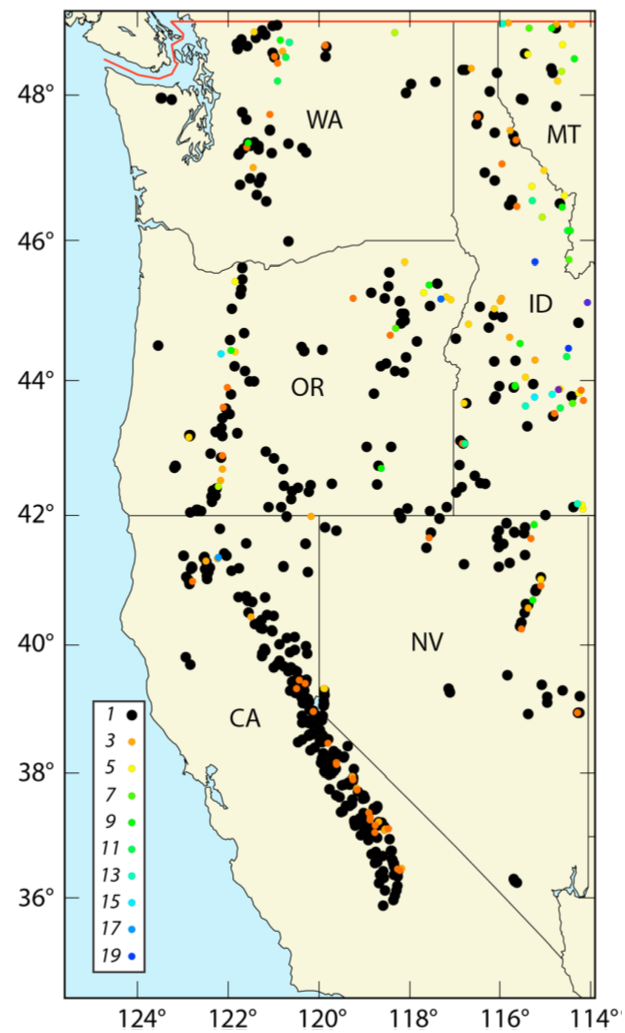
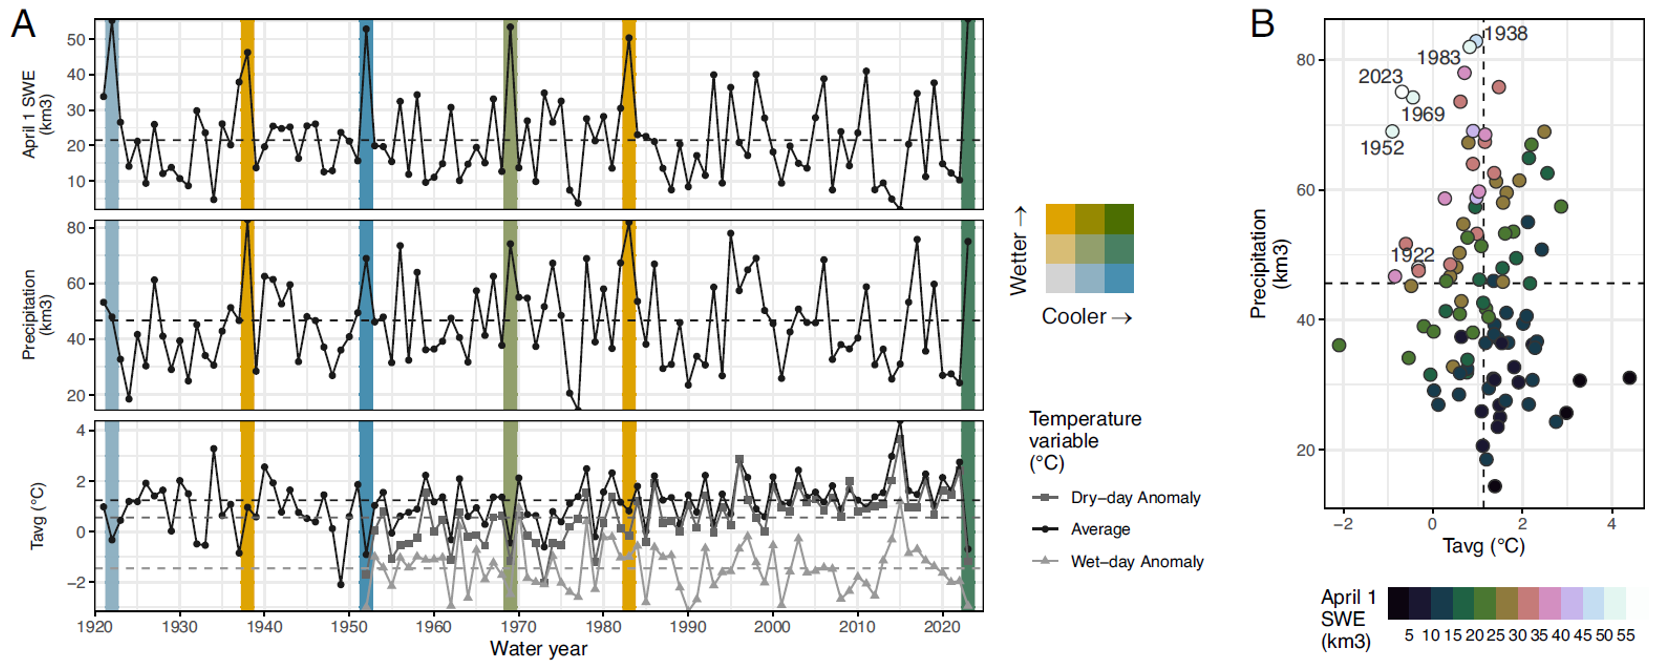
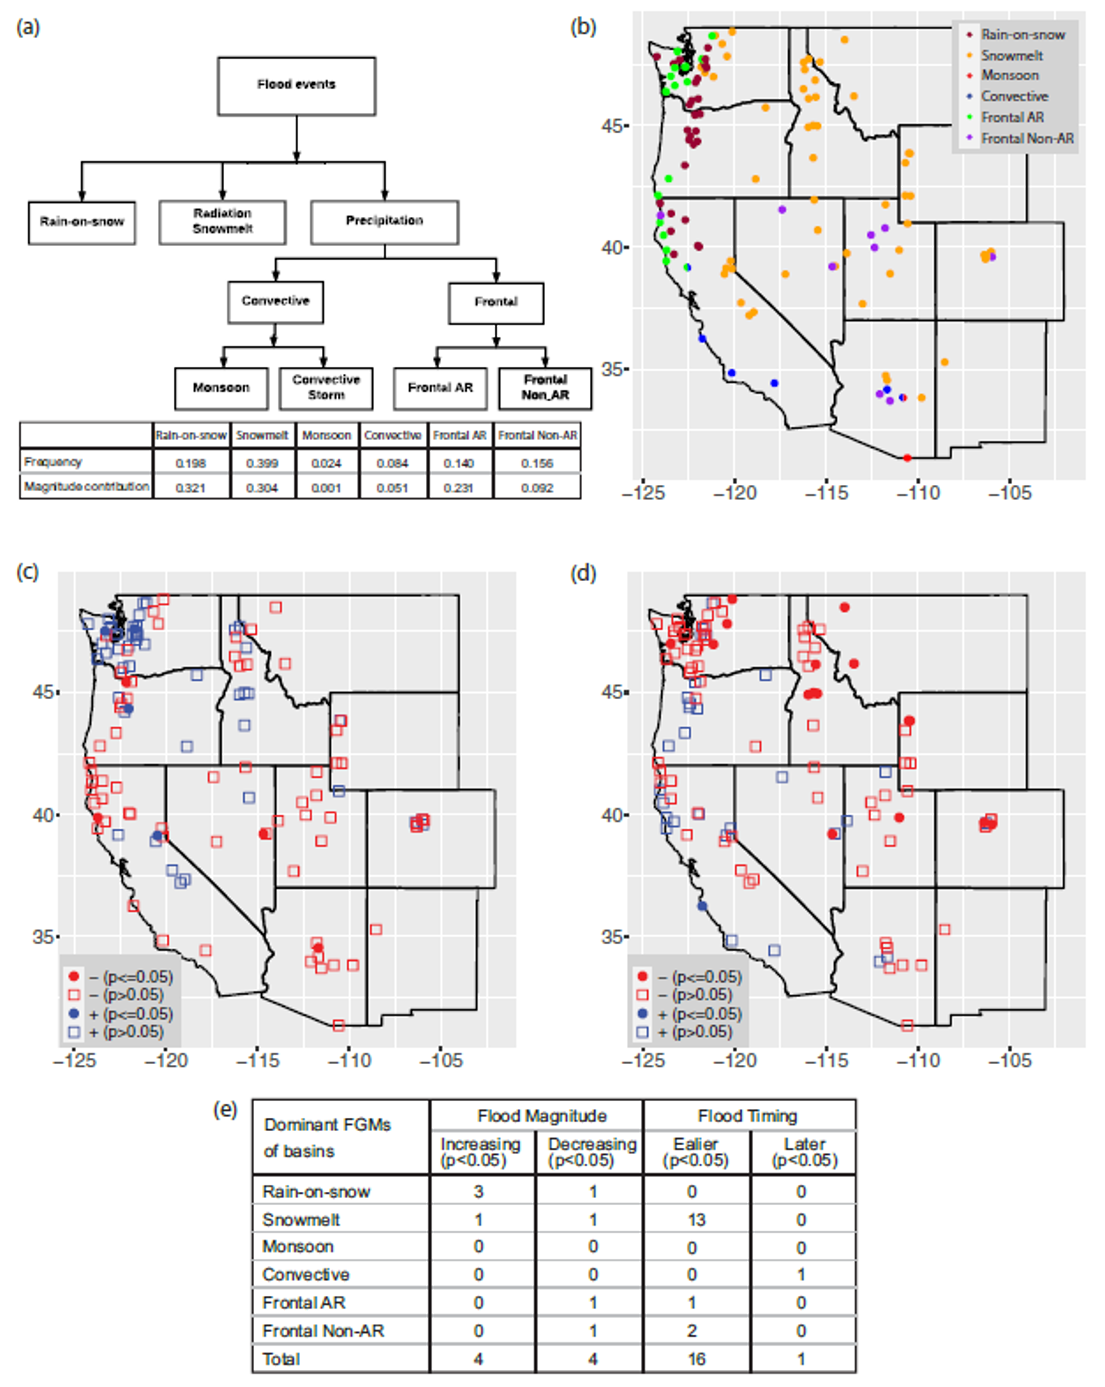
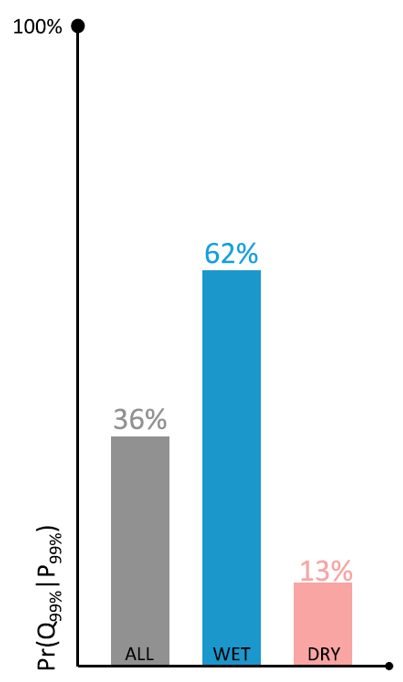
Table 1. Comparison of anomalies between the Midcentury Drought (D1) and the Millennium Drought (D2) (Xiao et al., WRR, 2018)