Listen here on Spotify | Listen here on Apple Podcast
Episode released on April 23, 2026
Episode recorded on February 26, 2026
 Augusto Getirana discusses global flooding in 2025, the new SWOT satellite, advances in NASA modeling and flood work in Brazil.
Augusto Getirana is a Research Scientist in the Hydrological Sciences Laboratory at NASA’s Goddard Space Flight Center. Augusto’s research involves the development, improvement and application of state-of-the-art computational models and integration of remote sensing data.
Highlights | Transcript
Today we are going to discuss applications to global and regional flooding, the relatively new SWOT satellite for surface water monitoring globally, improvements in NASA models and integrating with satellite data, and lastly your work in Brazil related to the Amazon, floods and droughts and need for planning.
Globally Flooding based on HyMAP and Impacts in 2025
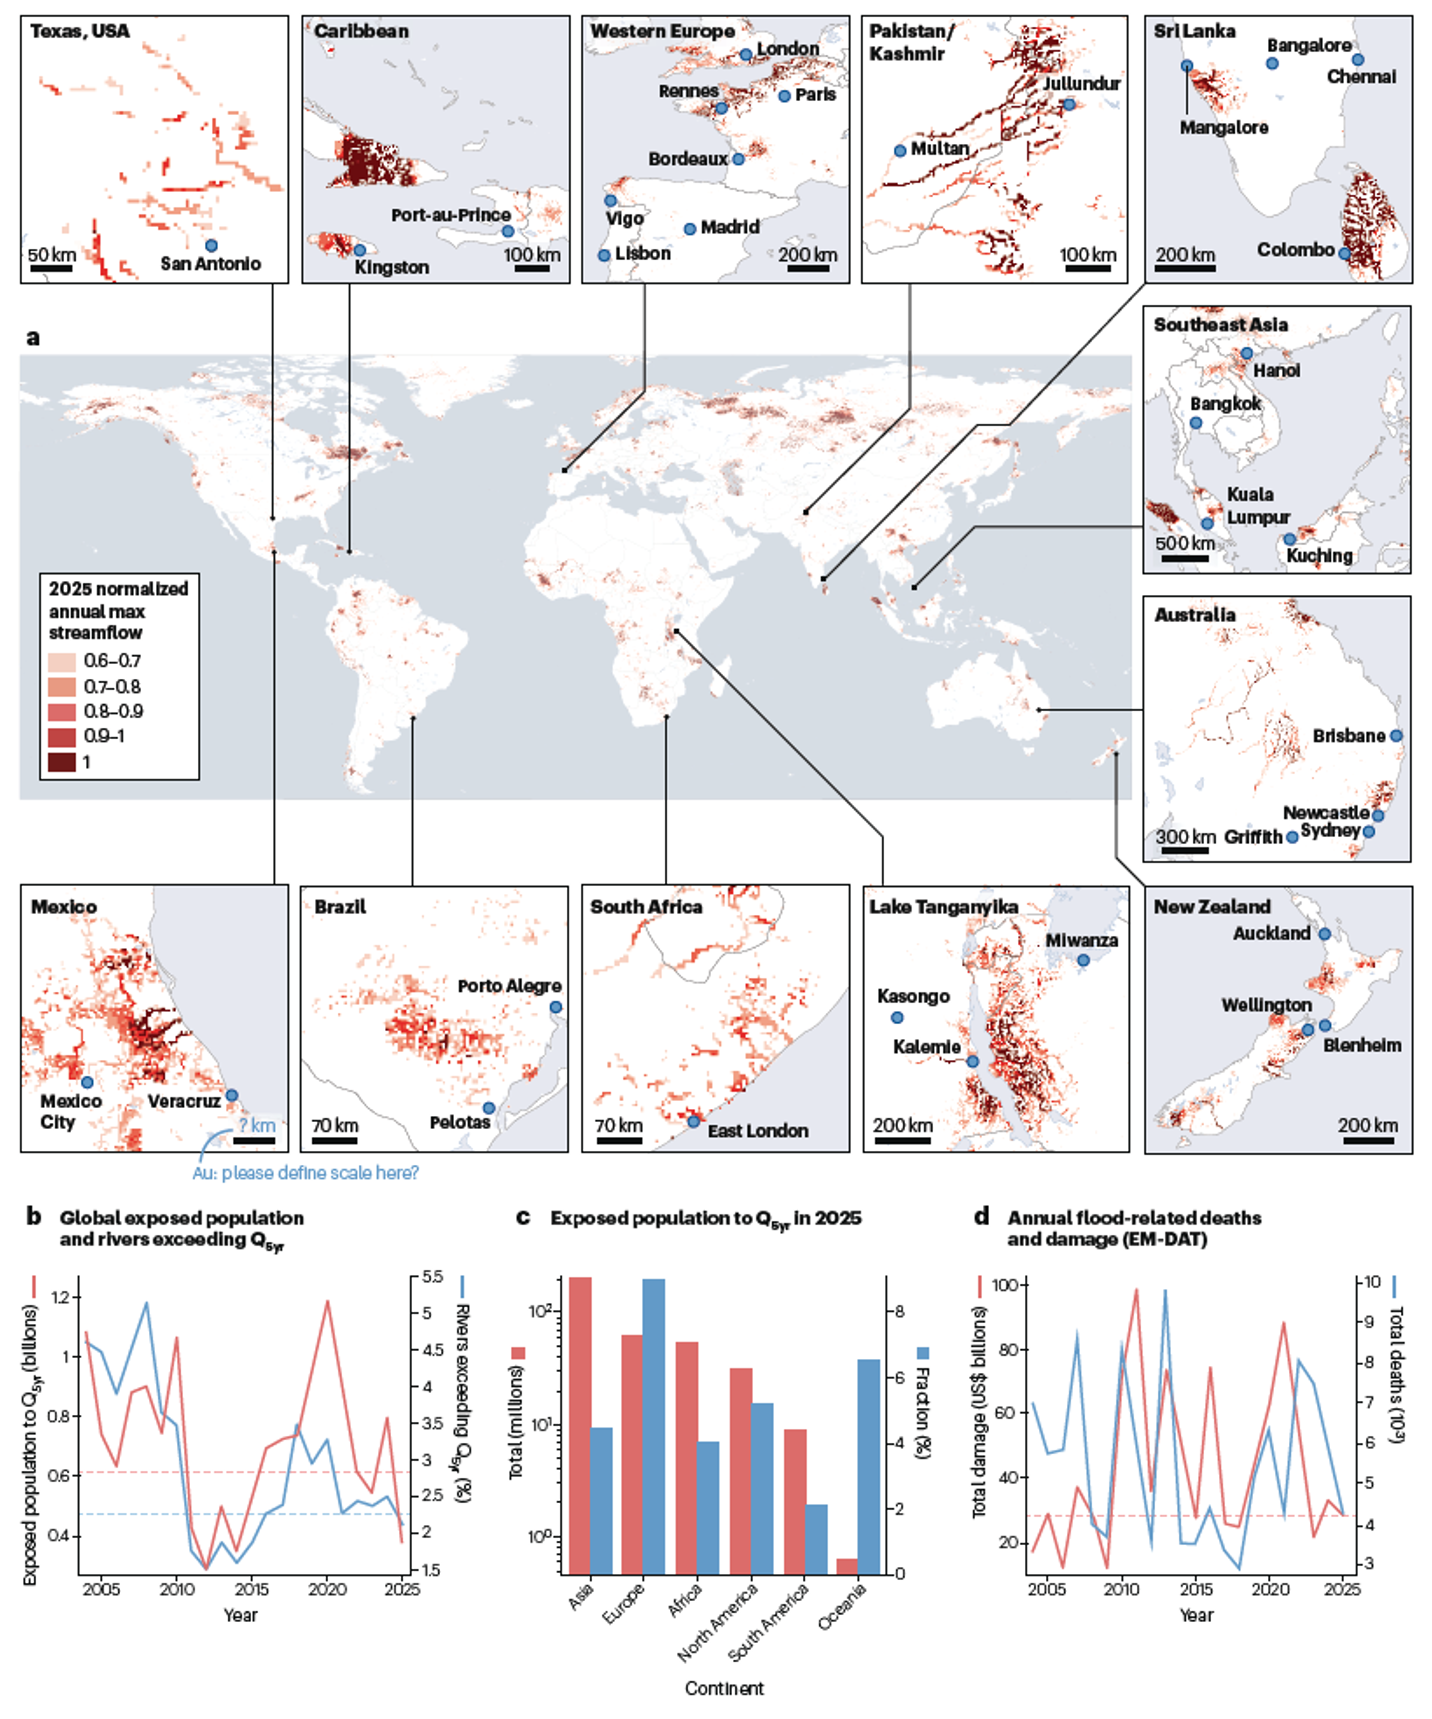
- Global flood impacts in 2025 were relatively low (Fig. 1) (Getirana et al., Nature Review Earth & Environment, 2026)
About 4,200 deaths and ~$28B in damages—still substantial, but ranked in the lower tier of the past two decades. This assessment was supported by both model outputs (HyMAP forced with GLDAS runoff) and observed disaster records from EM-DAT, providing consistency between modeled and reported impacts. - No clear increasing trend in global flood extremes
Analysis over ~20–22 years using HyMAP simulations (~5 km resolution) and EM-DAT data shows no consistent upward trend in extreme river flows, exposed population, or damages. This challenges the widely held assumption that flood extremes are steadily worsening globally. - Perception vs reality gap in climate extremes
Increased media coverage and real-time access to global events may amplify perceptions of worsening floods. However, long-term datasets do not yet show strong global trends, highlighting the need to distinguish perception from statistically robust evidence. - Key drivers of flooding include:
a. Precipitation intensity and duration
b. Antecedent soil moisture conditions
c. Topography and drainage characteristics
d. Infrastructure capacity and condition
e. Human exposure and land use
Floods result from the interaction of these factors rather than rainfall alone, emphasizing system complexity.
- Regional flood drivers differ widely with the following examples:
a. Asia: prolonged monsoon rainfall overwhelming rivers and infrastructure
b. Texas: intense short-duration rainfall over steep terrain causing flash floods with little warning
c. Brazil: saturated soils from prior extreme events increasing runoff and repeated flooding
These examples illustrate that flood mechanisms are region-specific and require tailored modeling and management approaches. - Flood risk includes hazards, exposure, and vulnerability
a. Flood hazard (rainfall/runoff) is only one component; impacts depend heavily on where people live and how prepared systems are. Population exposure overlays with modeled flood extent were critical to understanding impacts. - Flood severity reflects exposure and preparedness, not just rainfall magnitude.
a. Events with similar hydrologic intensity can have very different outcomes depending on warning systems, infrastructure, and public awareness—highlighting the importance of preparedness and planning.
Urban Flood Modeling (Rio de Janeiro)
- NASA partnership developed high-resolution (200 m → 10 m) flood mapping using HyMAP, approaching building-scale detail.
Using HyMAP downscaled outputs, NASA and the Rio municipality created detailed flood maps that can resolve impacts at near-building scale, enabling actionable local decision-making. - Operational flood forecasting is a key goal.
The system is transitioning from monitoring to forecasting, with a target of 1–2 day lead time. This would allow emergency managers to anticipate flooding rather than react after impacts occur. - Data availability is foundational for resilience.
The project emphasizes that effective flood management begins with reliable data. Without monitoring and forecasting systems, cities cannot plan mitigation or response strategies effectively. - Strong collaboration between NASA and local stakeholders is essential
The success of the Rio project depended on sustained engagement—monthly meetings, training, and knowledge exchange—ensuring tools are usable and tailored to local needs (link). - Urban flooding in Rio is driven by seasonal rainfall and infrastructure limitations (Getirana et al., Journal of Hydrology, 2023)
Flooding occurs mainly during the November–April rainy season, exacerbated by steep terrain, orographic rainfall, and insufficient drainage system maintenance and capacity.
Surface Water and Ocean Topography (SWOT) Satellite
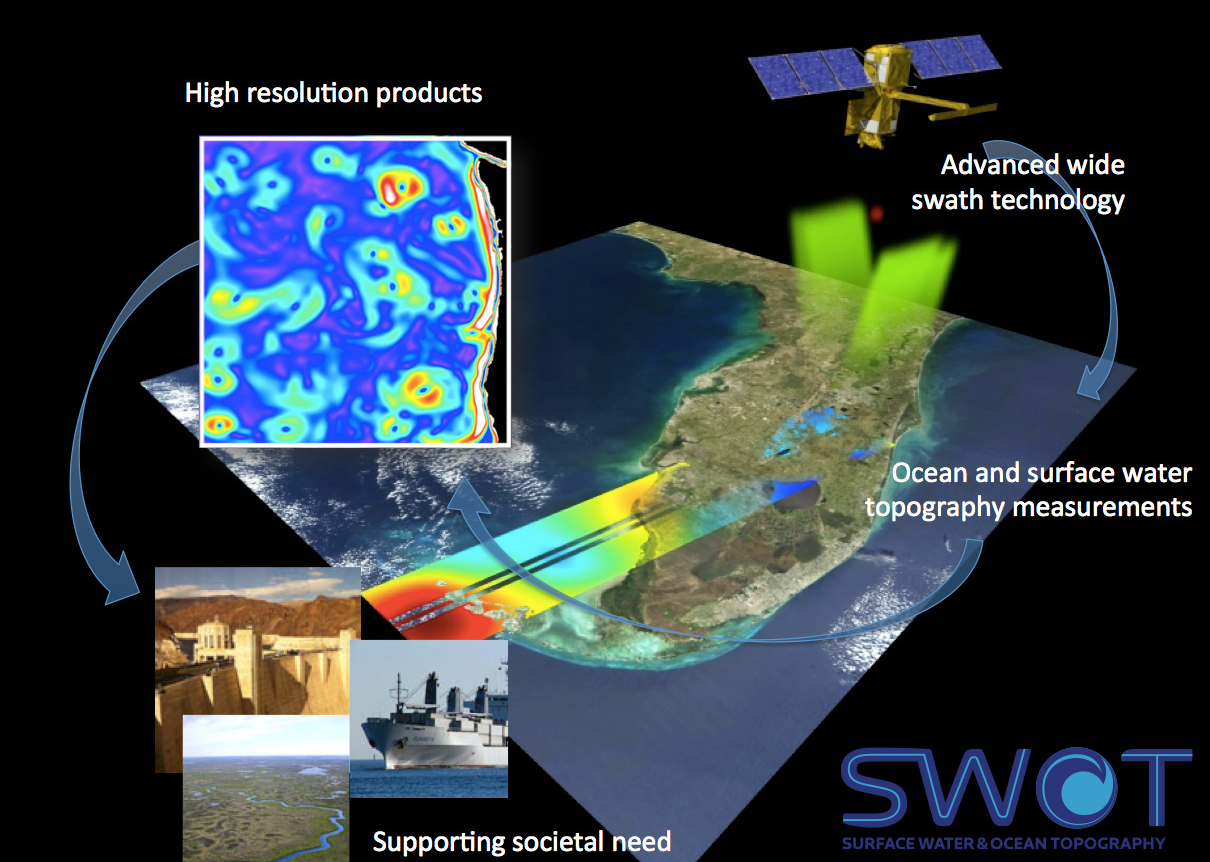
- SWOT satellite is a major breakthrough (Fig. 2) (Getirana et al., Nature Water, 2024)
Launched in December, 2022, U.S. French satellite (link).
Unlike traditional altimetry (narrow tracks), SWOT provides wide-swath (~120 km) 2D measurements of water surface elevation, enabling global mapping of rivers, lakes, and reservoirs. - New hydrologic variables from SWOT
SWOT enables estimation of:
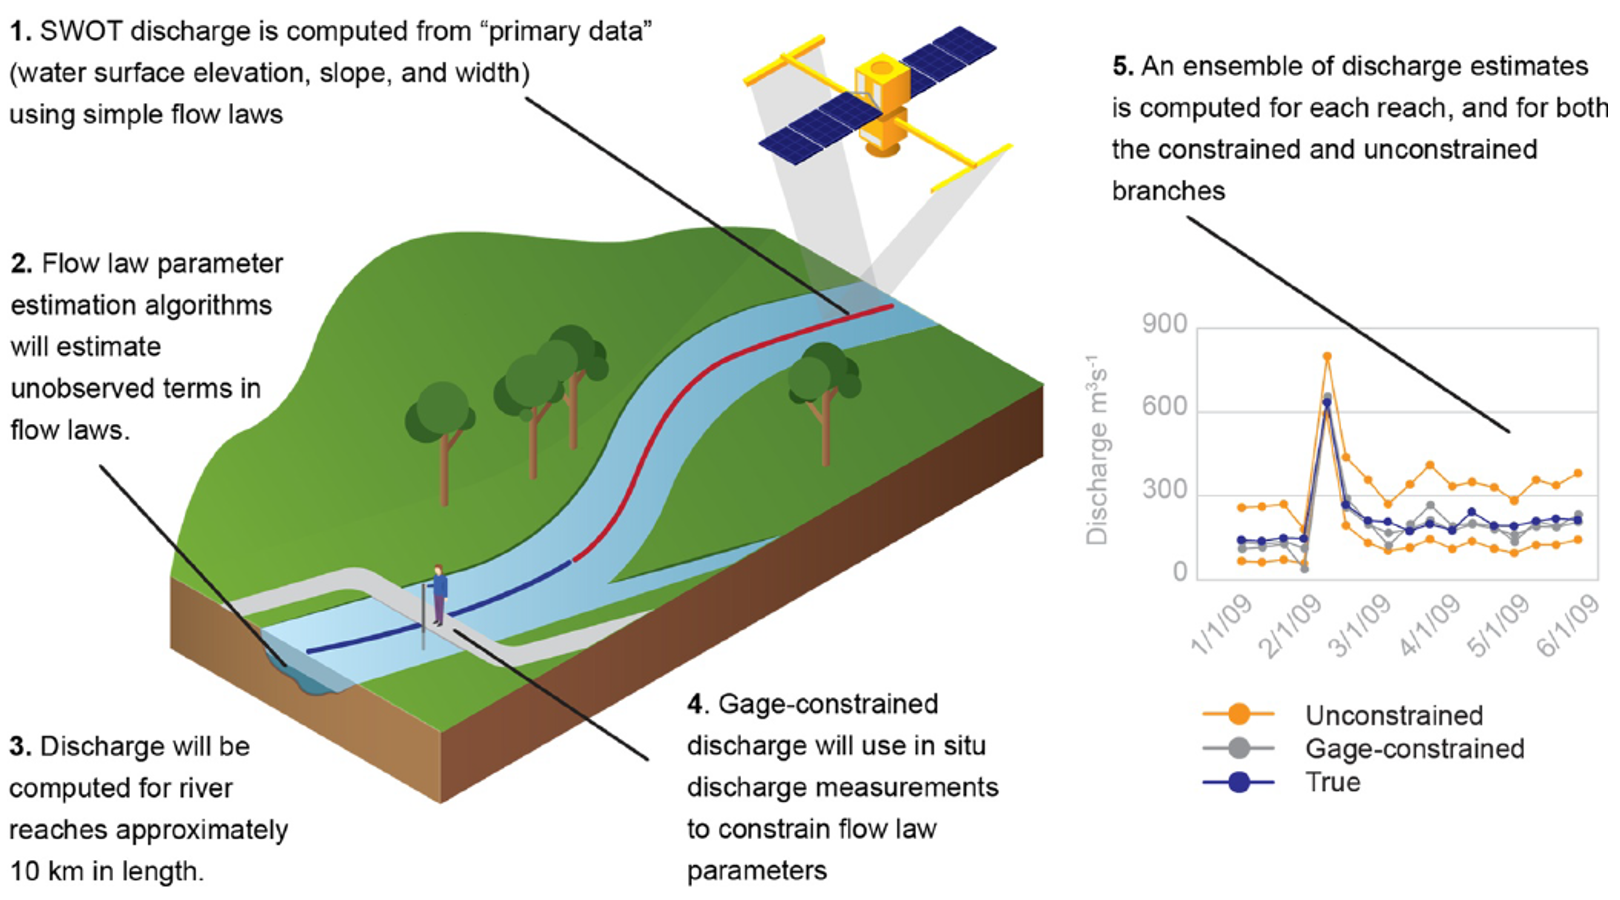
a. River discharge from river width (≥100 m wide) and slope (10 km reaches), flood extent (Discharge Algorithm Working Group, DAWG; Fig. 3) (Andreadis et al., GRL, 2025),
b. Water surface elevation (bodies ≥ 50 m)
c. Reservoir storage and volume change
d. Coastal flooding, river ocean interactions
These variables were previously difficult or impossible to measure globally.
- Improved discharge estimation
Early evaluations (e.g., South America) show SWOT-derived discharge can outperform modeled discharge (e.g., HyMAP) in some regions, especially where in-situ gauges are sparse. - Global coverage fills major observational gaps
SWOT provides spatially distributed discharge estimates even in large, ungauged basins like the Amazon, where traditional measurements are extremely limited. - Reservoir and lake monitoring is significantly improved
SWOT enables consistent global monitoring of reservoir levels and storage, critical for hydropower, water supply, and transboundary water management. - Temporal limitation of SWOT
~21-day revisit at the equator limits continuous monitoring, requiring integration with hydrologic models to interpolate between observations and maintain temporal continuity.
nominal lifespan: 3.5 yr. - Integration with models is essential
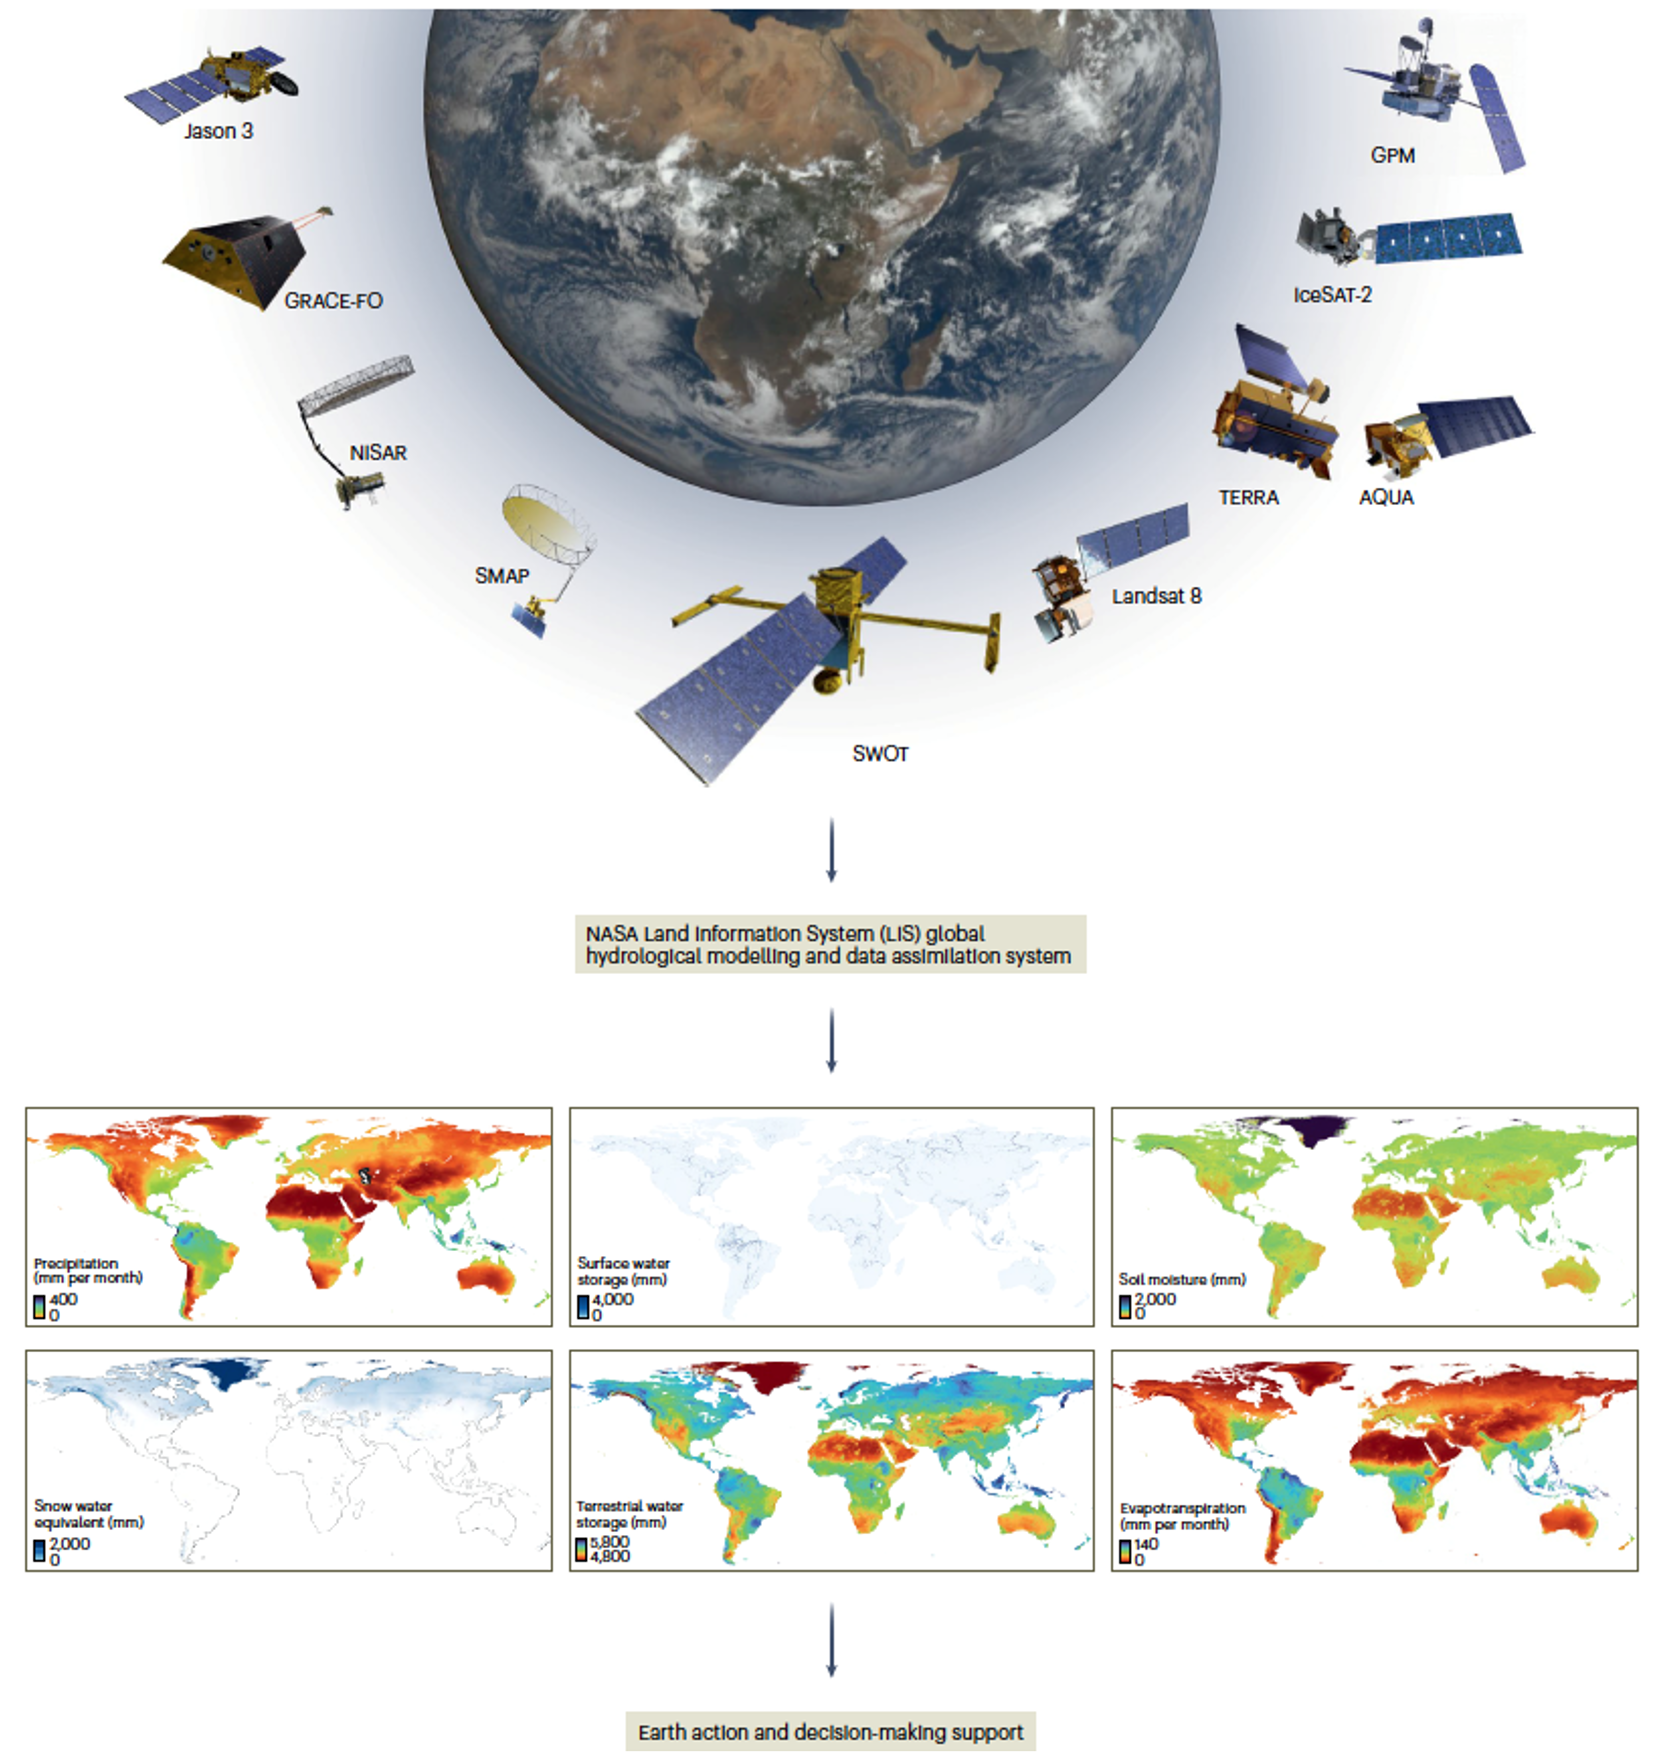
Models act as “dynamic interpolators” between satellite observations, combining SWOT data with hydrologic modeling frameworks to improve accuracy and temporal resolution (Fig. 4).
National Land Data Assimilation System Version 3
- Next-generation modeling systems (NLDAS-3)
NLDAS is used for a variety of different applications (Fig. 5). Represents a major upgrade in land surface modeling for North America, designed to support operational water management and hazard prediction. - Major upgrades include:
a. 1 km resolution (vs 12.5 km previously)
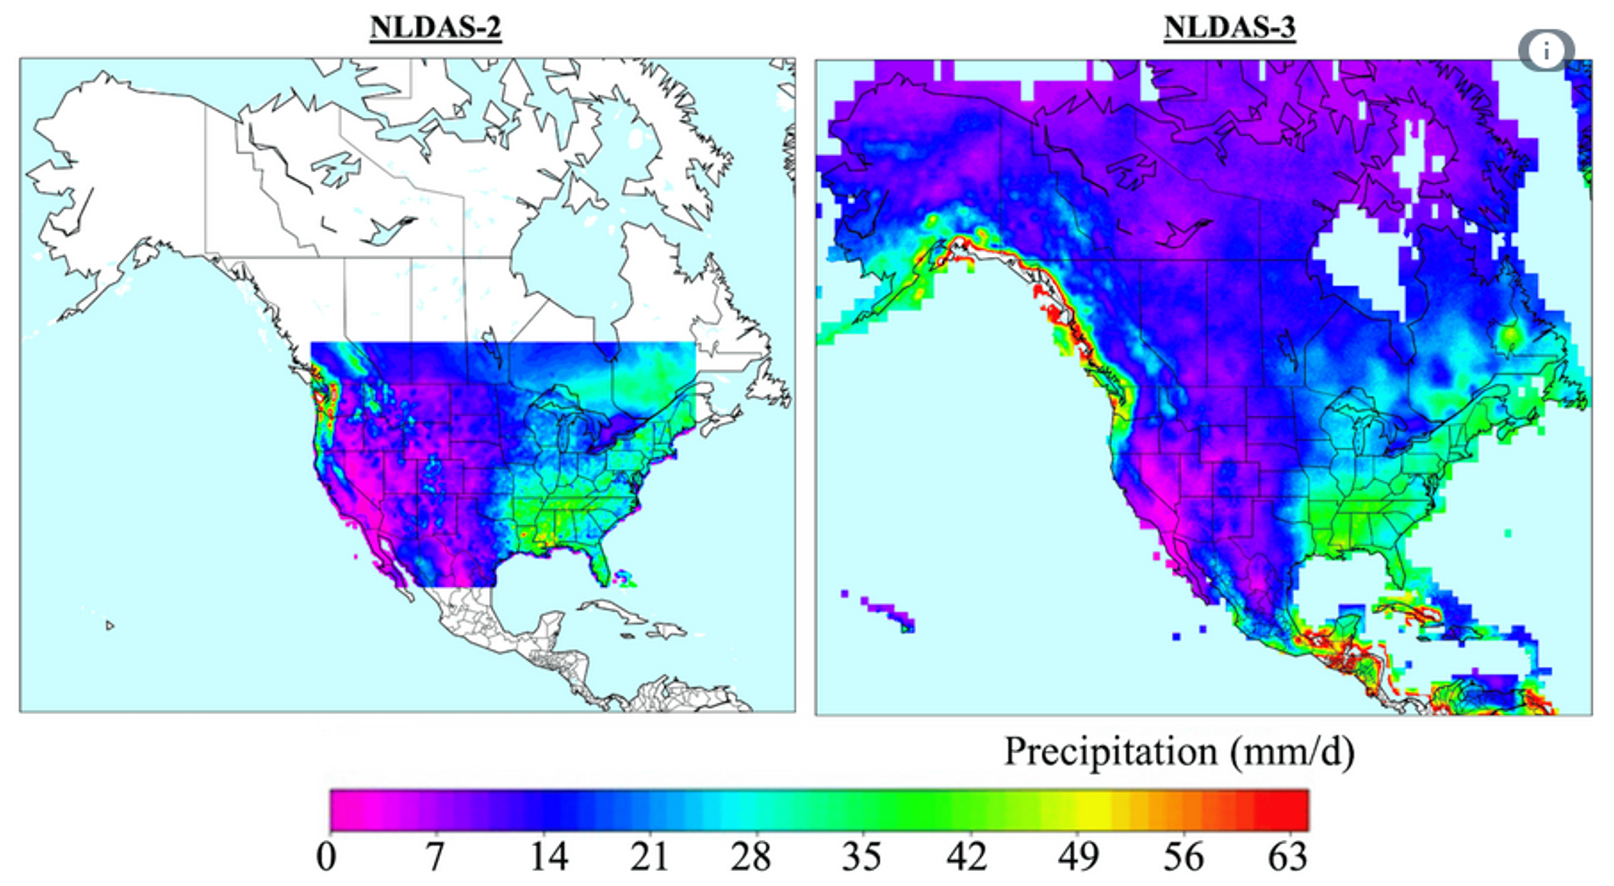
b. Expanded domain (Central America, Alaska, Caribbean and Hawaii) (Fig. 6)
c. Near-real-time outputs (from 3.5 days to 7-hour latency)
d. Improved groundwater processes (He et al., GMD, 2023)
e. Include surface water dynamics (river discharge and depth, flow velocity, surface water storage, flood extent)
These improvements greatly enhance spatial detail and timeliness for decision-making.
- Integration of multiple datasets:
NLDAS assimilates
a. GRACE (total water storage)
b. SMAP (soil moisture)
c. SWOT (surface water)
d. Vegetation and other satellite-derived dataset
e. Irrigation, groundwater withdrawal, droughts, floods, hydrological impacts of wildland fire
f. Land surface modeling based on NOAH-MP
g. Surface water modeling based on HyMAP - Coupling with HyMAP for surface water dynamics
Integration with river routing models allows simulation of discharge and flooding, linking land surface processes to river systems. - Strong stakeholder engagement
Development involves collaboration with ~150 professionals across 46 U.S. states, including NOAA and drought management agencies, ensuring outputs meet real-world needs. - NASA’s shift toward “science to action”
Emphasis is on translating research into operational tools that directly benefit society, including flood forecasting, drought monitoring, and water resource management.
Recent Droughts in Brazil and Need for National Drought Plan
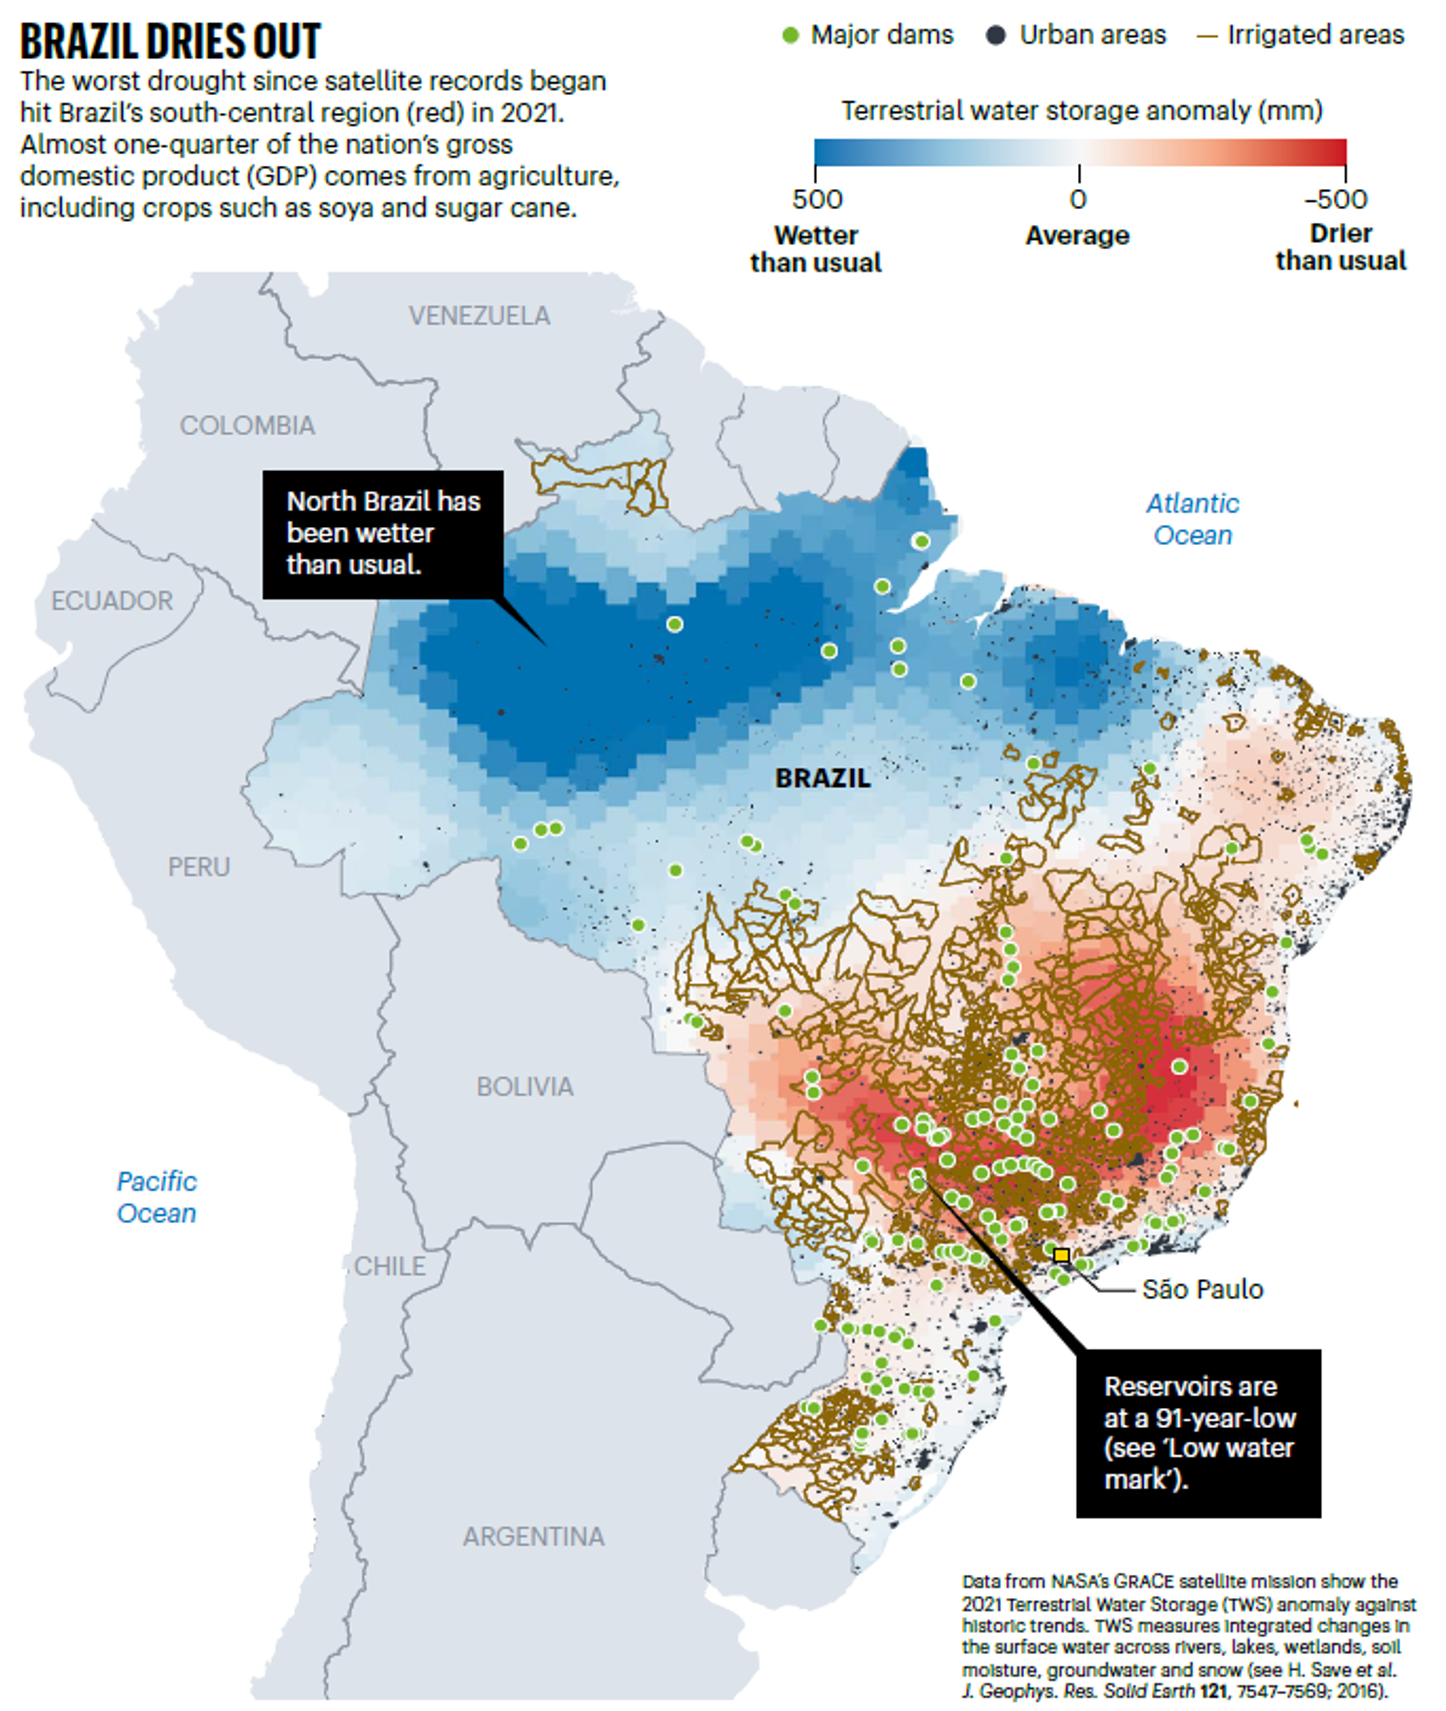
- Brazil: water-rich but vulnerable
Despite ~20% of global runoff, Brazil experiences frequent drought crises due to climate variability, regional imbalances, and land-use change (Fig. 7). - Amazon deforestation impacts hydrology
Deforestation disrupts “flying rivers” (atmospheric moisture transport), reducing rainfall in other regions and intensifying drought conditions. - Hydropower dependence increases risk
~70% of Brazil’s electricity comes from hydropower, making droughts a major economic and societal risk, affecting energy security and commodity production. - Drought impacts are global
Water shortages in Brazil affect global markets (e.g., coffee, soybeans), demonstrating the international implications of regional hydrologic extremes. - Groundwater is underutilized and under-monitored
Brazil has only a few hundred monitoring wells—orders of magnitude fewer than the U.S.—limiting its ability to use groundwater as a drought buffer. - Groundwater as a strategic backup resource
Groundwater could serve as a “savings account” during droughts, but requires improved monitoring and management to avoid overexploitation. - Need for a national drought plan
Improved monitoring (satellites + wells), data integration, and planning are essential for managing drought risk and ensuring sustainable water use across Brazil.