Listen here on Spotify | Listen here on Apple Podcast
Episode released on November 13, 2025
Episode recorded on September 5, 2025
 John Nielsen-Gammon discusses climate extremes, including the July 4th flooding and 2011 drought, with insights into communicating risk.
Highlights | Transcript
- John Nielsen-Gammon presentation to the legislature during the Interim Hearings (Youtube link).
- Kerr County flooding on July 4th, 2025, high intensity rain (3 – 4 in/hr, totaling 10 – 15 inches)
- Remnants of Hurricane Flossie in the Pacific, Tropical Storm Barry in the Atlantic, plus high humidity from the Gulf of Mexico.
- Slow-moving low-pressure area tapping high levels of atmospheric moisture.
- Extreme rainfall watch covered much of west and central Texas, difficult to forecast location of storm.
- Contributing factors to fatality, happened at night, holiday (July 4th), intense rain over 3 hr period.
- Previous floods on the Guadalupe:
- 1935 flooding, June, ≤21 inches of rain on May 31 in 3 hours, Woodward Ranch on Seco Creek. World record for precipitation intensity over 3 hr. Peak discharge ~230,000 cfs in Seco Creek. High antecedent soil moisture, tropical storm from Tampico (MX), happened during the day, no fatalities of campers.
- 1921 storm Thrall Texas, 36 inches of rain in 18 hr, impacted Thrall and Austin, Category 1 hurricane landfall in MX Sep 7 1921.
- 1921 flooding in San Antonio, 51 fatalities, creation of flood control system after this flood, including the San Antonio River Walk.
Flood planning
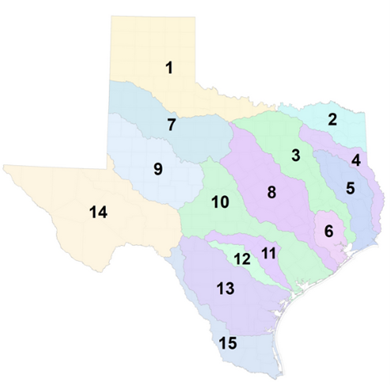
- Texas Water Development Board flood planning, 15 regional flood planning groups (Fig. 1), designated by TWDB in 2020, resulting in the 2024 State Flood Plan.
- John Nielsen-Gammon, James Doss-Gollin (Rice Univ.), and TWDB staff are developing future rainfall frequency grids for Texas in a new project (Texas Rainfall Analysis Incorporating Nonstationarity, TRAIN, now called TxRAIN).
- Increasing T increase moisture holding capacity of atmosphere (Clausius Clapeyron Equation).
- Considering historical trends (regionally, Bayesian Spatial framework) (Lu et al., 2024) merging with future trends.
- Maximizing data from short and long-term records and regionally to estimate extreme precipitation probabilities (intensity, duration, frequency).
- Extreme precipitation data are critical for future planning, risk management, and infrastructure development.
Hazard Communication:
- Hunt, Texas near core of recent July 4th flooding has had 110 flash flood warnings over the past 23 years.
- Hurricane Rita: deadly evacuation from Houston, 100 people died (link).
- Need to communicate not just hazards but appropriate action (e.g., stay, go etc).
- National Weather Service, warnings, e.g., tornado warning, go to safe place.
- Minor flash flood, appropriate action, e.g., stay put, don’t drive.
- Major flash flood, may need to go to higher ground, risk of lightning.
- Future may include personalized messages to people with weather app knowing your location, elevation data, predicting height above river. Will need cell phone coverage.
- Local monitoring: example during recent flooding, water softener beeping, designed for leak detection but detected flooding in home.
- Norfolk, Virginia, Waze flood alert app, provides information to drivers on flooding, passable roads, with drivers providing feedback.
Need for Increased Monitoring:
- Monitoring of atmospheric conditions (Temperature, Pressure, Wind) varies regionally, can have widely spaced monitoring.
- Water vapor, can have fine structure, need more detailed monitoring.
- For example, atmospheric rivers coming from Pacific landfalling in West Coast, monitoring using ships releasing weather balloons in Pacific, then airplanes, and more recently satellite data.
- Texas:
- need monitoring along the Gulf of Mexico which sources about half of the incoming air during extreme events.
- Between Brownsville and El Paso, only one upper air site (Del Rio).
- Test the value of proposed additional monitoring stations by including them in modeling past extreme events.
Drought:
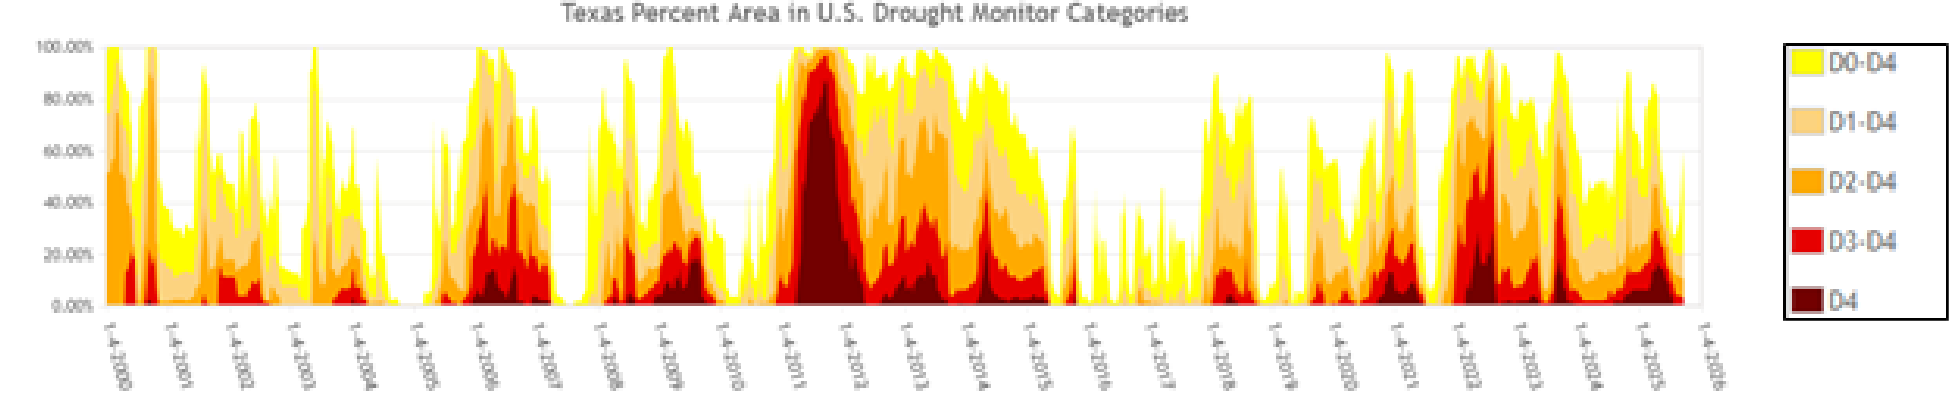
- 2011 worst one-year drought in Texas, did not recover until 2015, based on Texas Drought Monitor data (Fig. 2).
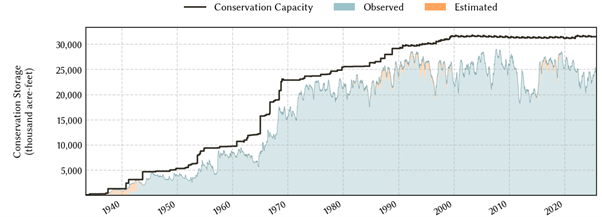
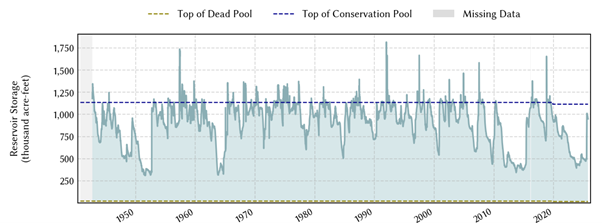
- Reservoirs also showed the impact of the 2011 – 2015 drought (Fig. 3).
- Rainfall during 2012, 2013, and 2014 was fairly normal but insufficient to overcome large drought deficit during 2011. Flooding during 2015 ended the long-term drought.
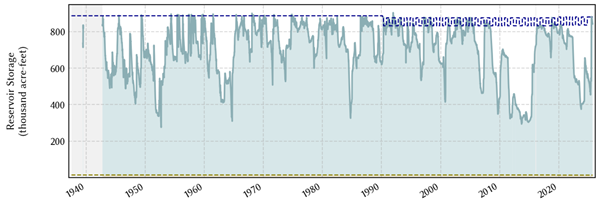
- Highland Lakes (Lakes Buchanan and Travis, water supply reservoirs for Austin, recovered to 88 – 98% of capacity after July floods) (Fig. 4).
- 2023 drought: 2nd week of June, storms carried away from Texas: air sinking and warming, heat wave, humid, then humidity decreased, heat dome developed (presentation link).
Time series of Palmer Modified Drought Index showed the drought evolution in 2023. - Droughts begin when it stops raining, but only if it stays dry for months or more; difficult to predict when this might happen.
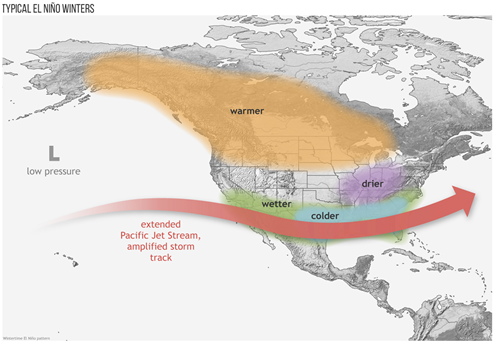
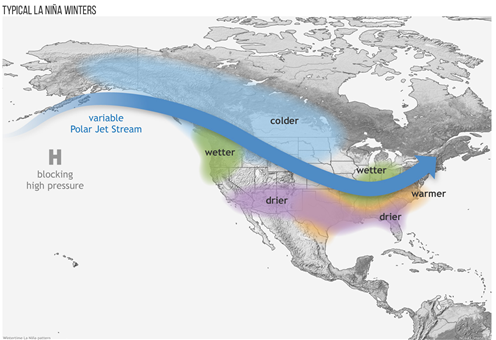
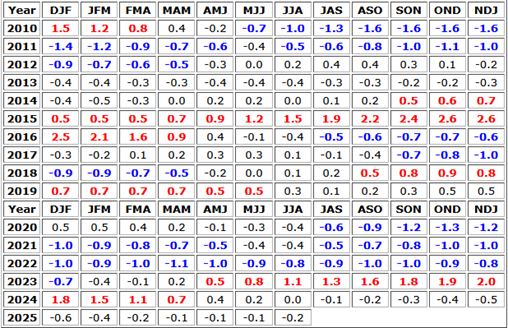
- El Niño Southern Oscillation may be linked to droughts and wet cycles (Fig. 5):
- El Niño results in a southward shift of the Pacific Jet Stream amplifying the storm track (Fig. 5a).
- La Niña results in a northward shift of the Pacific Jet Stream, lowering precipitation in the southern third of the US (Fig. 5b).
- Strong La Niña conditions would be expected to reduce rainfall in Texas by 20 – 25% but decreased in by 50 – 60% in 2011 (Table 1).
- Dry soils provide positive feedback on drought, amplifying drought.
- If drought extends into Northern Mexico, air coming into Texas aloft is dry, providing a lid on convection.
- Drought can be self-perpetuating.
- Different types of droughts:
- Meteorological drought, lack of rainfall, flash drought, rapid onset.
- Agricultural drought: soil moisture, impacts crop yields
- Hydrological drought: observed in streamflow, reservoir storage, and groundwater levels.
- Meteorological drought, lack of rainfall, flash drought, rapid onset.
- Southern Regional Climate Center: developing new product partitioning rainfall into soil moisture or runoff using approach developed by USDA.
- TxH2O published by the Texas Water Resources Institute had an excellent publication documenting droughts in Texas since 1900 (Texas drought: now and then).
- Water supply droughts often end in floods making it difficult to predict the end of a drought: e.g., 1950s drought, flooding in 1957.
Report: Extreme Weather in Texas: 1900 – 2036 by Nielsen-Gammon and others, 2024: for Texas2036 (Fig. 6).
- 2036 represents the bicentennial of Texas independence.
- Only projecting for 10 – 15 years, can rely heavily on recent trends in data.
- Not all extremes are getting worse: cold extremes are getting better with rising temperature.
- Tornadoes trends? increased data in recent years with people chasing tornadoes, impacts decreasing with improved buildings, etc., but severity of tornadoes may not have changed.
- Number of 100°F days increasing, projected to double between now and 2036, some related to local urbanization (heat out effect from air conditioning, less natural vegetation etc) and some linked to climate change.
- Rising temperatures, increasing evaporation, drier soils, droughts getting worse even if rainfall stays the same.
Image
Image
Image
Image
Image
Image
Image
Image
Image